Biotech Behemoths in Review
Share:

Here at Pear, we specialize in backing companies at the pre-seed and seed stages, and we work closely with our founders to bring their breakthrough ideas, technologies, and businesses from 0 to 1. Because we are passionate about the journey from bench to business, we created this series to share stories from leaders in biotech and academia and to highlight the real-world impact of emerging life sciences research and technologies. Read more about Pear’s approach in biotech here.
In this review, we look back at the top 50 biotech companies of the past 15 years. This post was written by Pear Partner Eddie and Pear PhD Fellows Alan Tung, Ami Thakrar, and Gary Li.
Introduction:
Life sciences companies have the unique opportunity to transform scientific discoveries into drugs, diagnostics, and technologies that can substantially improve people’s well being. In the past decade and a half, we’ve seen dramatic progress in the sector: the approval of several highly impactful drugs (e.g., COVID vaccines, checkpoint inhibitors, GLP-1 agonists), the rapid maturation of emerging therapeutic modalities (gene therapies, cell therapies, gene editing, protein degraders, ADCs, radiopharma, etc.), and the increasing adoption of technologies used in biology research and in diagnostics (NGS, epigenetics, transcriptomics, proteomics, single cell biology, spatial biology, organoids, etc.).
We were motivated to highlight 50 biotech startups that have recently generated tremendous value for patients, for investors, and for the sector. Given the long development timelines involved in biotech, we focused this review on companies founded within the past 15 years, and we limited the scope to life sciences startups developing therapeutics, diagnostics, or tools.
As an admittedly imperfect indicator for the value generated, the top 50 startups were selected and ranked based on the valuations actually realized during the period via an exit by acquisition or a public financing. For the companies that went public and remained independent, we looked at the maximum of either the market cap at IPO or the market cap achieved at the end of the period.
To get a better sense of what these companies look like, we surveyed these “biotech behemoths” below with respect to their key products, the profiles of the founding CEOs and scientific founders, the origins of their lead programs and technologies, the founding location, the time to an initial exit, and several other characteristics of interest.
Methods:
Using Pitchbook, we screened for therapeutics, diagnostics, and life sciences tools companies founded between Jan 1, 2009 – Dec 31, 2023 in the US, Canada, and Europe. The top 50 companies were selected based upon the maximum of: the upfront or guaranteed value realized at the time of acquisition, or the company market capitalization either at IPO or at the end of the period on Dec. 31, 2023.
This approach means that a few companies were included that had a very high valuation at IPO, but ultimately did not retain this value (e.g., because of a subsequent disappointing clinical trial outcome). Given that different investors have different strategies when it comes to unwinding their positions in public companies, our intent in using this particular criterion was to prioritize those companies throughout the period that were likely to have been most meaningful in terms of financial value returned back to investors.
Spinouts from major companies were generally excluded; notable exclusions include Cerevel Therapeutics, spun out of Pfizer in 2018 and acquired by AbbVie in 2023 for $8.7B, and Viela Bio, spun out of AstraZeneca also in 2018 and bought by Horizon for $3B in 2021. However, we decided to include Grail, spun out of Illumina to work on a product application quite distinct from Illumina’s main NGS tool platform, as well as Telavant and Immunovant, spinouts of Roivant – which is itself a startup.
A handful of companies were identified and added to the list based on cross referencing Crunchbase, Pitchbook’s public company screener, and relevant biotech industry news sources and reports. Additional data pertaining to company and founder characteristics were obtained from company websites, press releases, SEC filings, available news sources, or where possible, primary research.
Constraints:
1) The valuation metric we applied for ranking is neither an intrinsic measure of value nor impact.
2) Many companies that ultimately generate tremendous benefits for patients or the industry get acquired or exit at an earlier stage at a lower value.
3) As noted above, some companies included in this ranking that were highly valued at the time of IPO or acquisition did not live up to this valuation due to clinical setbacks or commercial challenges.
4) We exclusively focused on the outliers in terms of success, and we did not run a comparison against companies that were not as successful. Accordingly, we would caution against any tendencies to form conclusions that suffer from survivorship bias.
5) Our data and results are limited by the available resources that we had access to as noted above. (Note: if we made any omissions or errors, please kindly let us know!)
6) The valuations were not adjusted for inflation.
Pear VC’s Biotech Behemoth rankings:
Product Impact
Among the behemoths, a whopping 46 (92%) were therapeutics companies, 3 (6%) were diagnostics companies, and 1 (2%) was a life sciences tools company. In the sections below, we survey some of their key products.
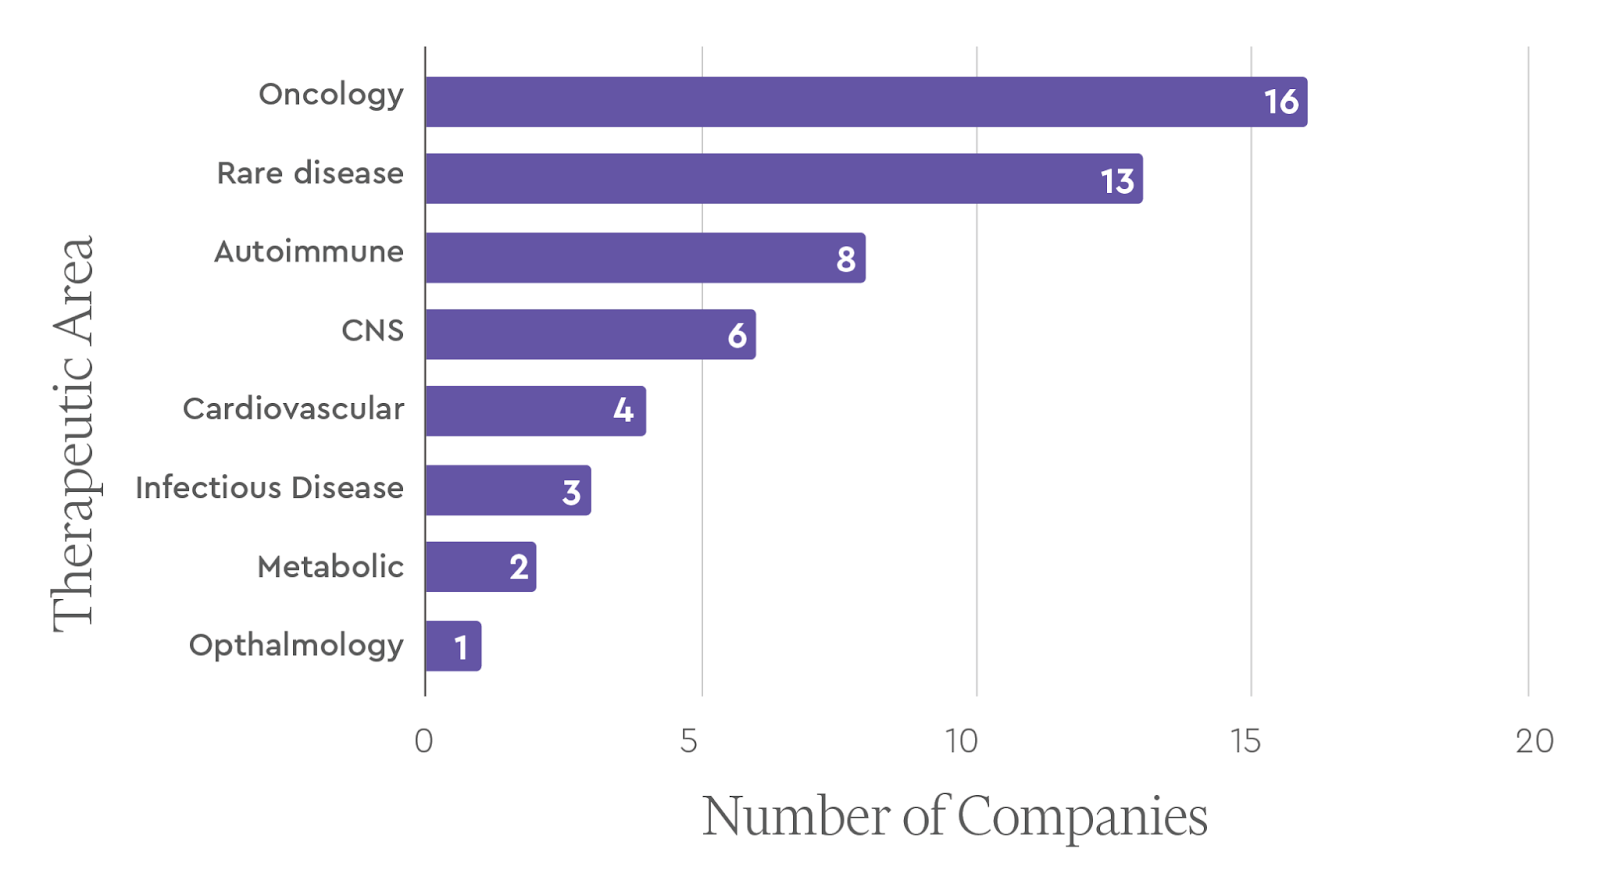
Therapeutics Companies – Indication Focus
The 46 therapeutics behemoths spanned all of the major indication areas including oncology, immunology, CNS diseases, and infectious diseases. Oncology was the most common lead therapeutic area (16 companies, 34.78%), followed by rare diseases (13 companies, 28.26%).
Current Clinical Stage of Therapeutics Behemoths (EOY 2023)

Among the top therapeutics companies, a majority (52%) achieved FDA approval for their lead drug programs by the end of 2023, with about a quarter reaching Phase 3 and the remainder in earlier clinical stages.
Snapshot of approved drugs by the top drug companies
We surveyed the approved drugs developed by the top therapeutics startups in our rankings. Company valuation was generally positively correlated with projected peak sales of the corresponding company’s approved drug.
| Developer | Brand Name | Generic Name | Projected Peak Sales* ($B) | Therapeutic Area(s) | Commercial Lead | Approval Year(s) | |
| 1 | Moderna | SpikeVax | Moderna COVID Vaccine | 18.4B (2022) | Infectious Disease | Moderna | 2020 |
| 2 | MyoKardia | Camyzos | Mavacamten | 2.3B (2030) | Cardiovascular | BMS | 2022 |
| 3 | Biohaven | Nurtec | Remigepant | 2.8B (2030) | CNS | Pfizer | 2020 |
| 4 | Juno | Breyanzi | Lisocabtagene maraleucel | 2B (2030) | Oncology | BMS/Celgene | 2021 |
| 5 | Kite | Yescarta | Axicabtagene ciloleucel | 2.6B (2029) | Oncology | Gilead | 2017 |
| 6 | Roivant | Vtama | Tapinarof | 0.41B (2032) | Autoimmune | Pfizer | 2022 |
| 7 | Avexis | Zolgensma | Onasemnogene abeparvovec-xioi | 2.1B (2029) | Rare Disease | Novartis | 2019 |
| 8 | Receptos | Zeposia | Ozanimod | 1.7B (2030) | CNS, Autoimmune | BMS | 2020 |
| 9 | Apellis | Empaveli, Syfovre | Pegcetacoplan | 0.66 (2029, Empaveli), 2B (2029, Syfovre) | Rare Disease: Ophthalmology | Apellis | 2021, 2023 |
| 10 | Loxo | Vitrakvi, Retevmo | larotrectinib,selpercatinib | 0.56 (2028, Vitrakvi), 0.76 (2029, Retevmo) | Oncology | Eli Lilly | 2018, 2020 |
*Source: GlobalData
Platform or asset driven?
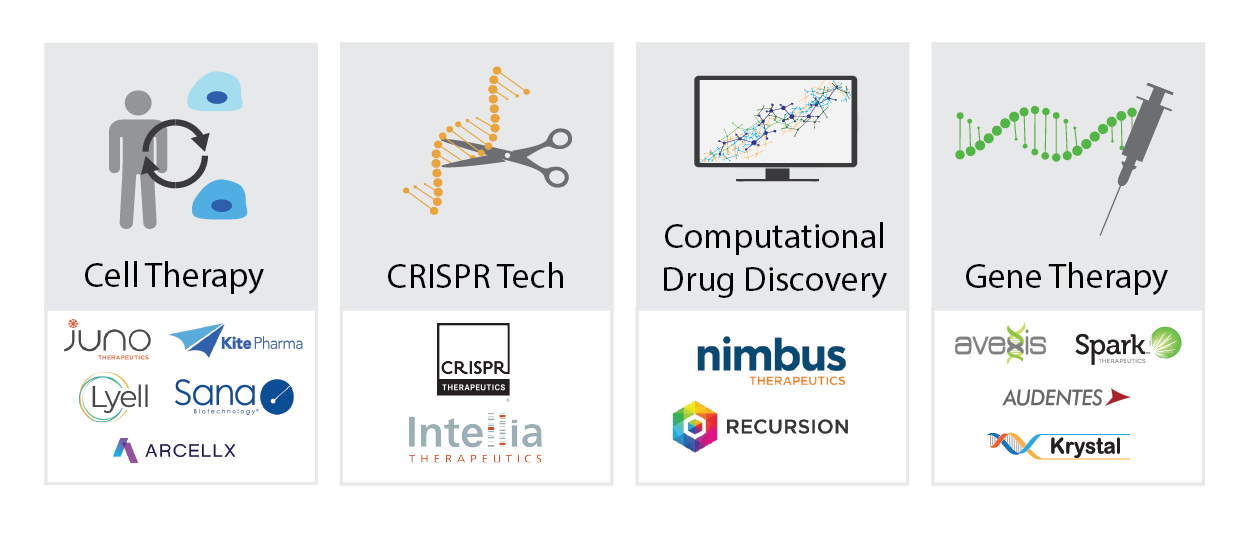
Among the top therapeutics companies, there were slightly more platform-driven companies (24 of 46) compared with asset-driven companies (22 of 46), but it is a fairly even split, especially considering that the definition of a platform is subject to a wide degree of interpretation. Here, we defined a platform as a key technology or discovery method that can lead to more than one asset. There are a few major themes among the platform-driven companies including those focused on cell therapies (Juno, Kite, Sana, Lyell, Arcellx); gene therapies (Avexis, Spark, Krystal Biotech, Audentes); CRISPR technology (CRISPR Therapeutics, Intellia); and computationally-driven drug discovery (Nimbus, Recursion).
Dx & Tools Products
There were just four diagnostics or tools companies out of the top 50 companies. Grail (founded in 2018) developed and launched the Galleri test for multi-cancer early detection. 10X Genomics (founded in 2012) commercialized instruments and reagents related to detailed sequencing and characterization of cellular genomes and transcriptomes. Foundation Medicine (founded in 2010) developed multiple tissue-based oncology genetic tests and was acquired by Roche in 2015. Guardant Health (founded in 2012) developed several liquid biopsy-based oncology tests for both early and advanced cancer.
| Company | Founded | Key Products |
| Grail | 2015 | Galleri blood-based genomic test for early cancer screening |
| 10X Genomics | 2012 | 1. Chromium Single Cell: profile single cell gene expression 2. Visium Spatial: spatial whole transcriptome analysis 3. Xenium In Situ: detecting and imaging RNA |
| Foundation Medicine | 2010 | 1. FoundationOne CDx: tissue-based companion diagnostic genomic test for solid tumors 2. FoundationOne Liquid CDx: blood-based companion diagnostic genomic test for solid tumors 3. FoundationOne Heme: comprehensive genomic profiling test for hematologic malignancies, sarcoma and certain solid tumors |
| Guardant Health | 2012 | 1. Guardant360 and Guardant 360CDx: blood-based comprehensive genomic profiling test for therapy selection for solid tumors 2. Reveal: blood-based genomic test for minimal residual disease detection and recurrence monitoring 3. Shield: blood-based genomic test for colorectal cancer screening |
Founding profiles:
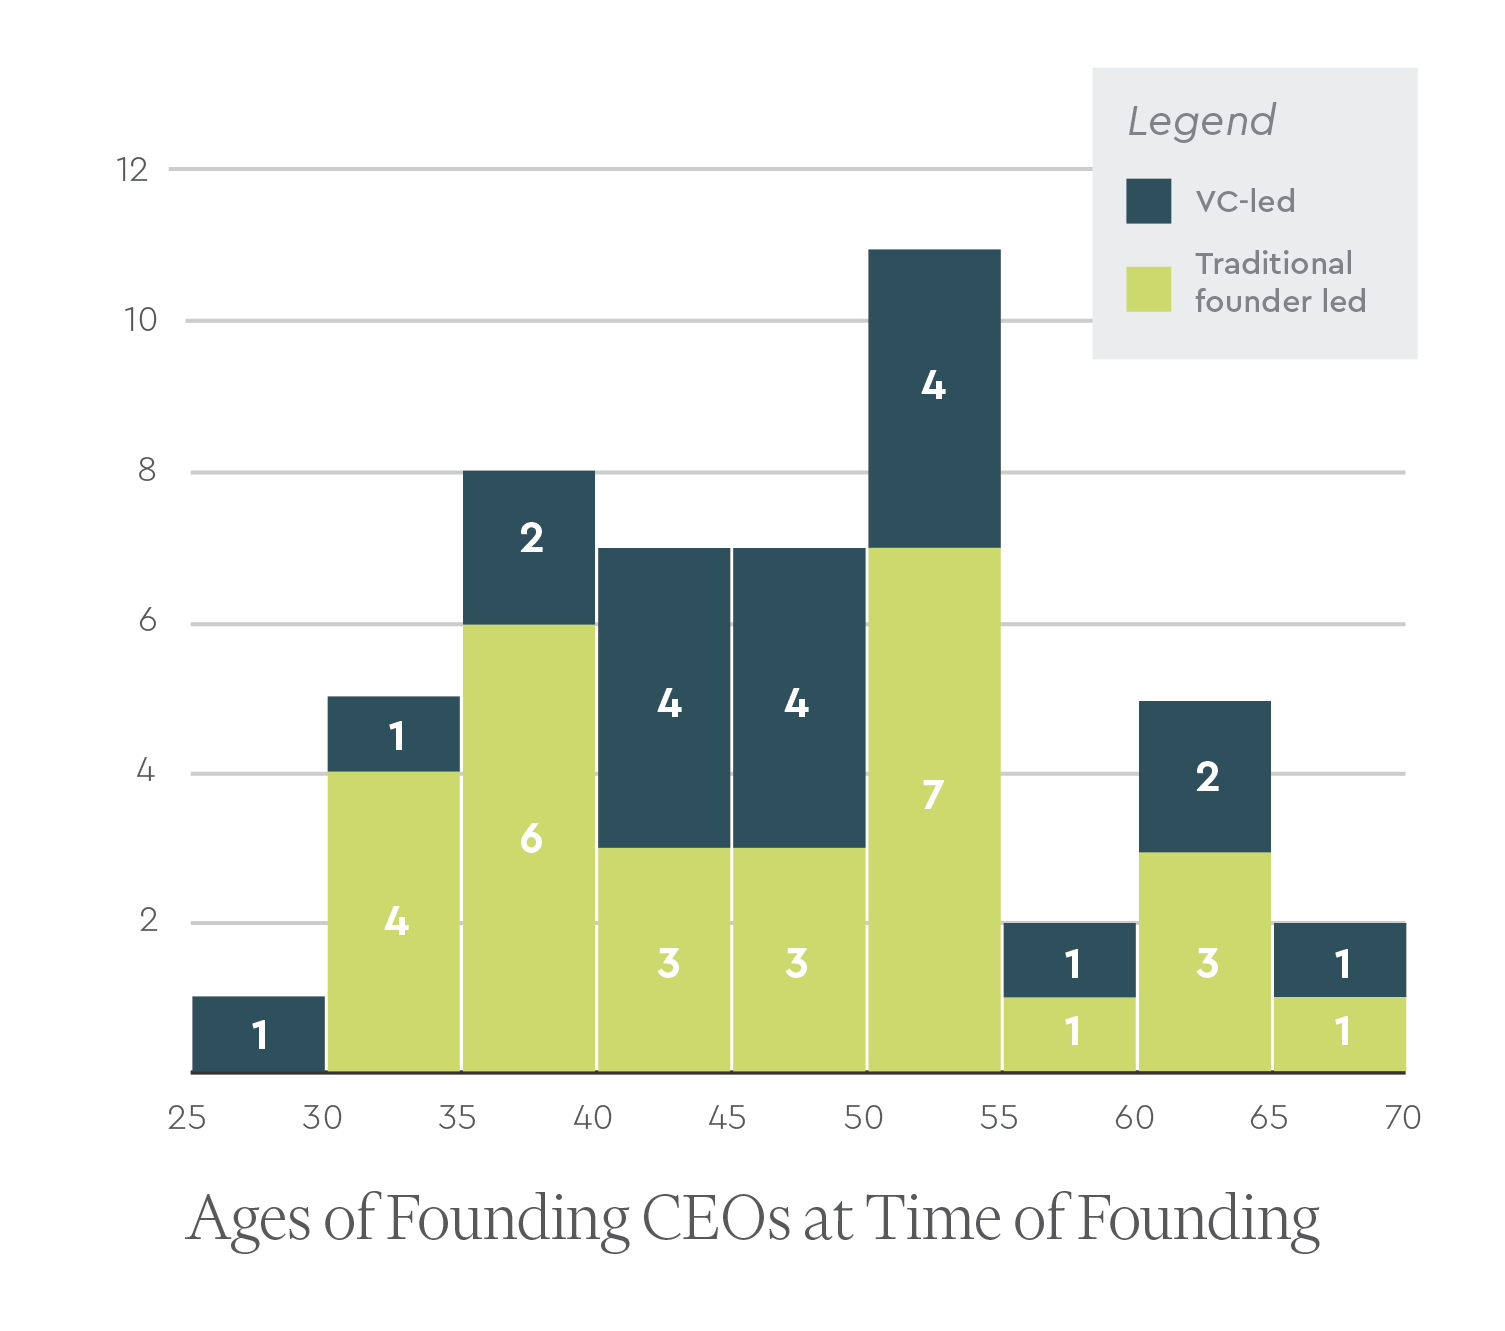
Founding CEO Age
We were able to find data on the age of the founding CEO (+/- 1 year) at the time of founding for 47 of the 50 companies we profiled. We found that across these 47 companies, the average age of the founding CEO at the time of founding was ~46 years old (+/- 10 years). In the diagnostics/tools space (only 4 companies), the average age dropped to 38 (+/- 5 years old), but in therapeutics, the sector that dominates the rankings, the average age was 47 (+/- 10 years old).
We also found no substantial difference in the average age of the CEO at founding for companies that were or were not VC incubated. For companies that were VC-led, the average age of the CEO at founding was ~48 (+/- 10 years old). This is only slightly older than the founding CEOs of companies that were not VC-led, who were on average ~46 years old (+/- 10 years).
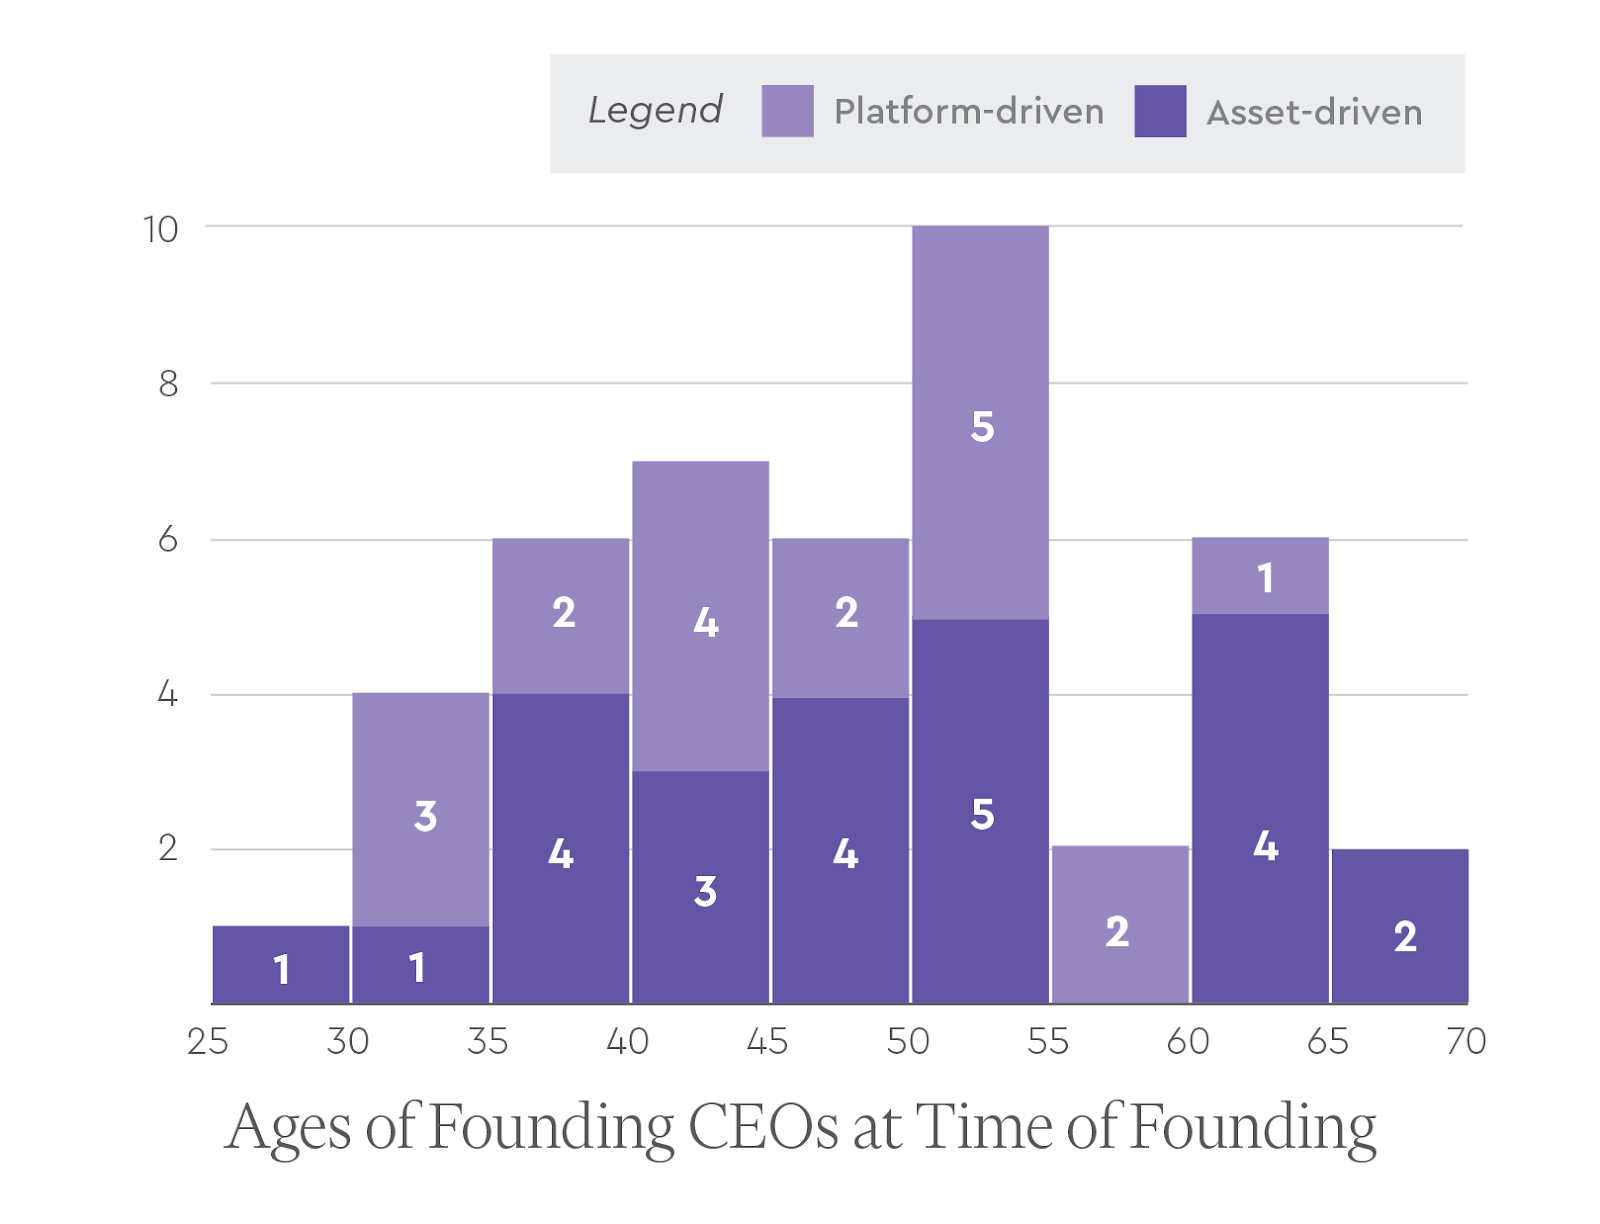
We sought to understand if the founding CEO ages were different for platform-driven vs. asset-driven companies. On average, the founding CEOs of platform-driven companies were slightly but not significantly younger at 46 years old (+/- 9 years) compared with those of asset-driven companies at 49 years old (+/- 11 years).
Experienced vs. First-Time CEOs
Interestingly, a little more than half (~53%) of the founding CEOs of the behemoths appeared to be first-time CEOs, and the remainder had previous CEO experience at one or more companies.
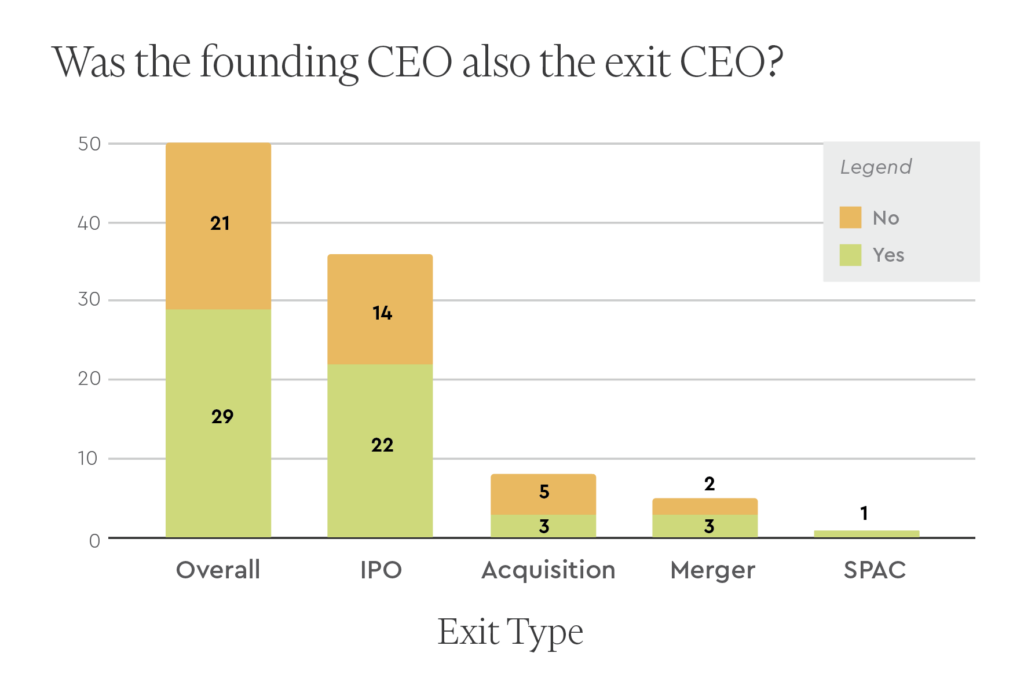
Did the Founding CEO Remain as the Exit CEO?
For 29 of the 50 behemoths, the founding CEO remained the CEO at least until the company’s initial exit (defined here as either a public financing event or an acquisition). This was more common in the case of IPOs (22 out of 36), mergers (3 out of 5), SPACs (1 out of 1), and less so for acquisitions (3 out of 8).
VC Incubation
One unique aspect of biotech venture capital is the strong tradition of hands-on company formation and incubation. To the extent we could determine based on publicly available information, the majority of the behemoths were not VC incubated, but a sizable minority (44%) were created and built by VC firms.
Among the 21 companies that were VC incubated, the firms represented most commonly were Third Rock (5 companies), ARCH (4), Atlas (3), Flagship (3), and Versant (3).
Founding CEO Equity Ownership
For those behemoths that went public, and that retained the founding CEO at IPO, we examined the founding CEO equity ownership just before the IPO. As shown below, the median CEO stake for these behemoths overall was 5.6%. Perhaps as expected, the median CEO ownership for those companies that were VC incubated (4.2%) was lower than those that were founder-led (7.4%).
| Founding CEO Equity Just Before IPO | Biotech Behemoths (n=29) | VC-Led Behemoths (n=13) | Traditional Founder-Led Behemoths (n=16) |
| Median | 5.6% | 4.2% | 7.4% |
| Mean | 10.0% | 6.1% | 13.1% |
| Standard Deviation | 11.5% | 5.9% | 14.0% |
| Max | 54.6% | 22.5% | 54.6% |
| Min | 1.0% | 1.0% | 2.4% |
Educational Backgrounds of Founding CEOs
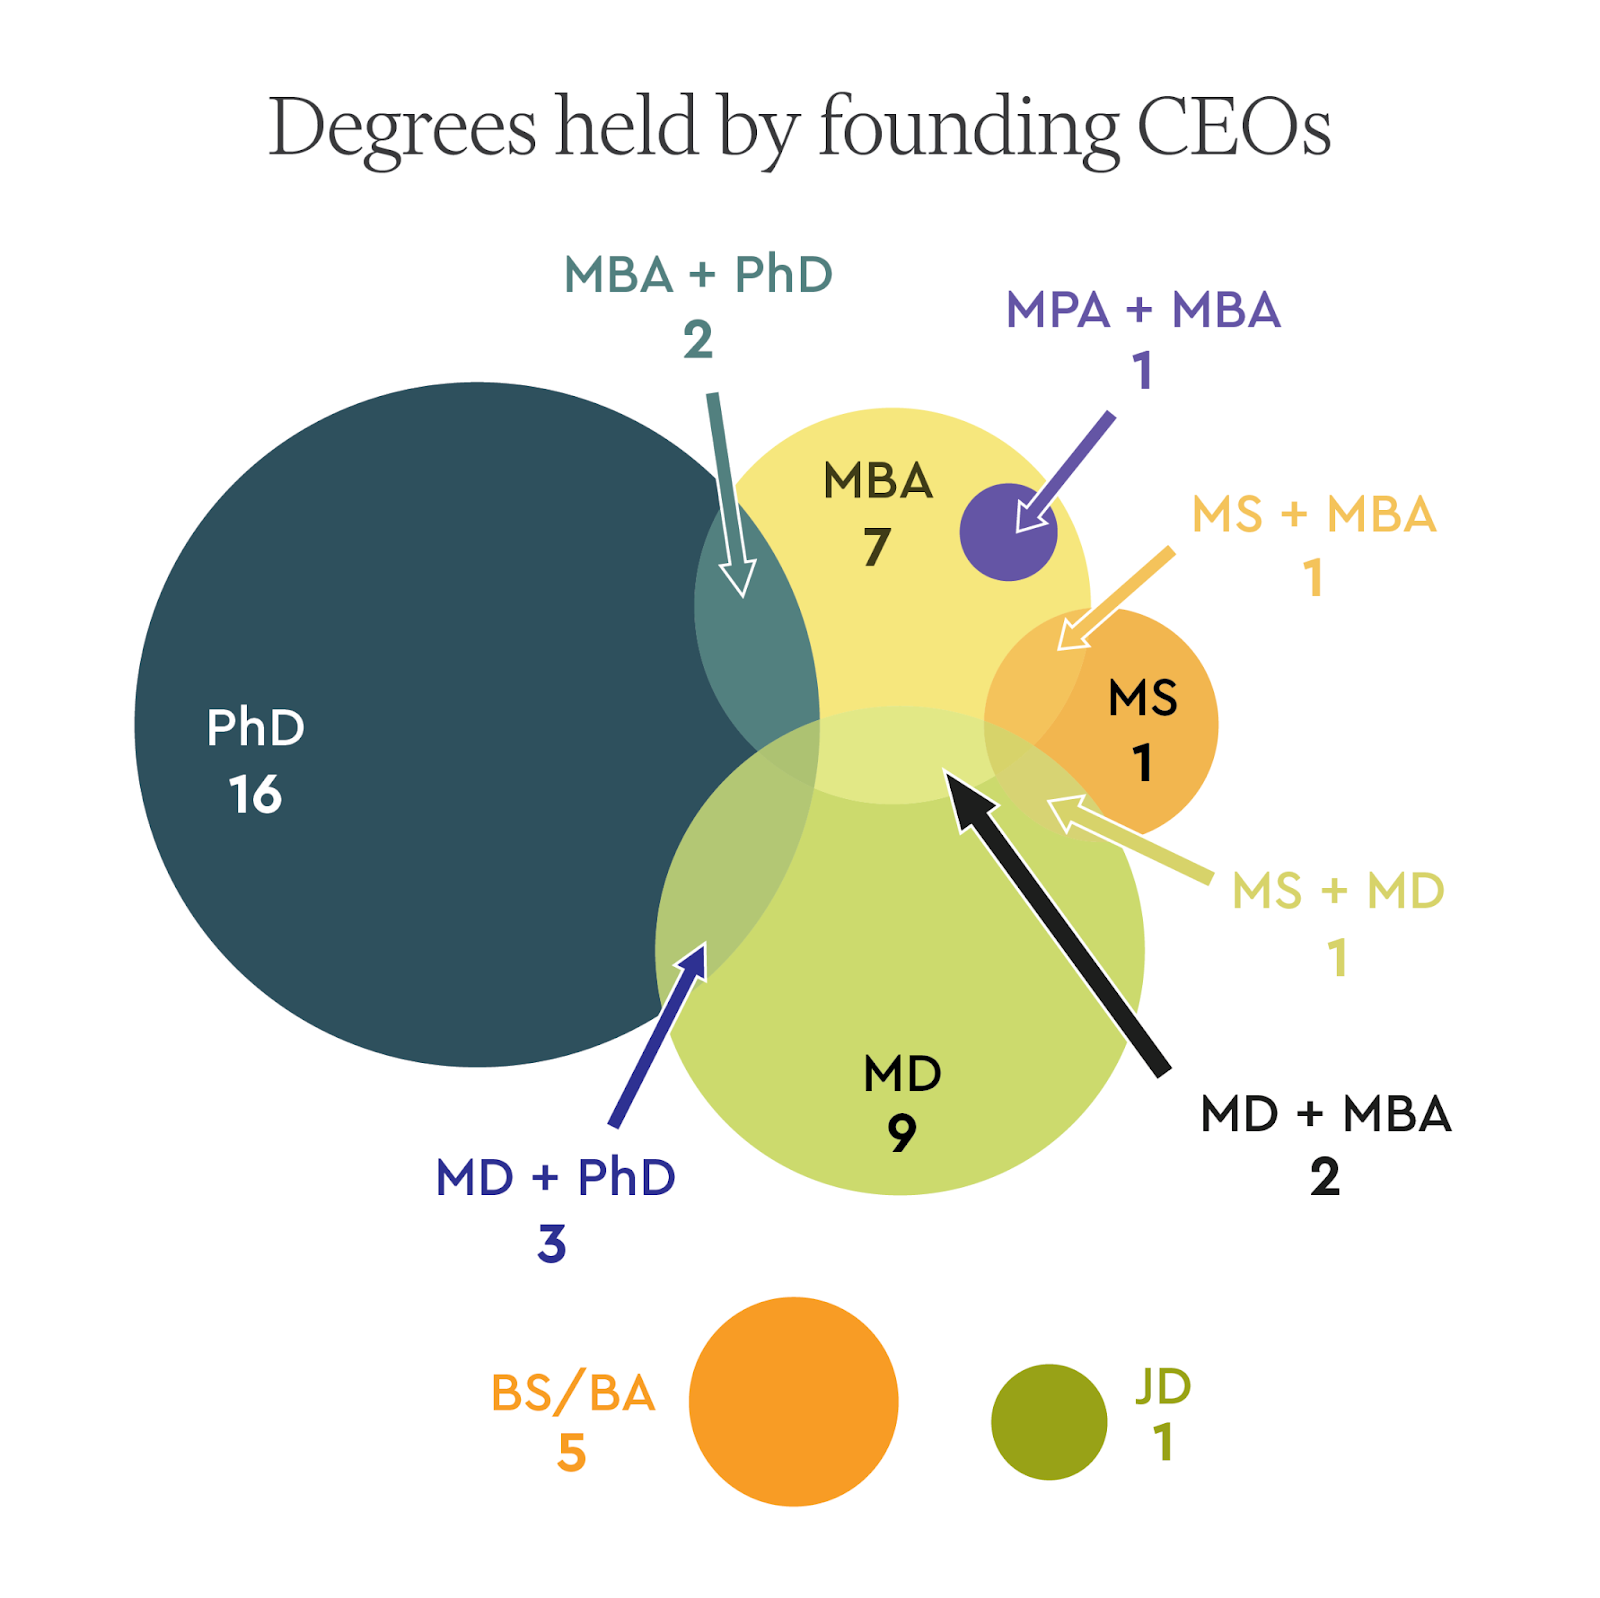
We reviewed the educational backgrounds of the founding CEOs. Of the 49 founding CEOs for whom we were able to find detailed educational data, the PhD was by far the most commonly held degree (21). The next most commonly held degree was an MD (15), followed by an MBA (13). The majority of founders held only one of these degrees, but there were a handful of MD/PhDs (3), MD/MBAs (2), and PhD/MBAs (2). Nearly all founding CEOs held a graduate degree (43), and most had specialized technical or scientific training via graduate school prior to starting their biotech company (35).
Academic Affiliations of Scientific Founders
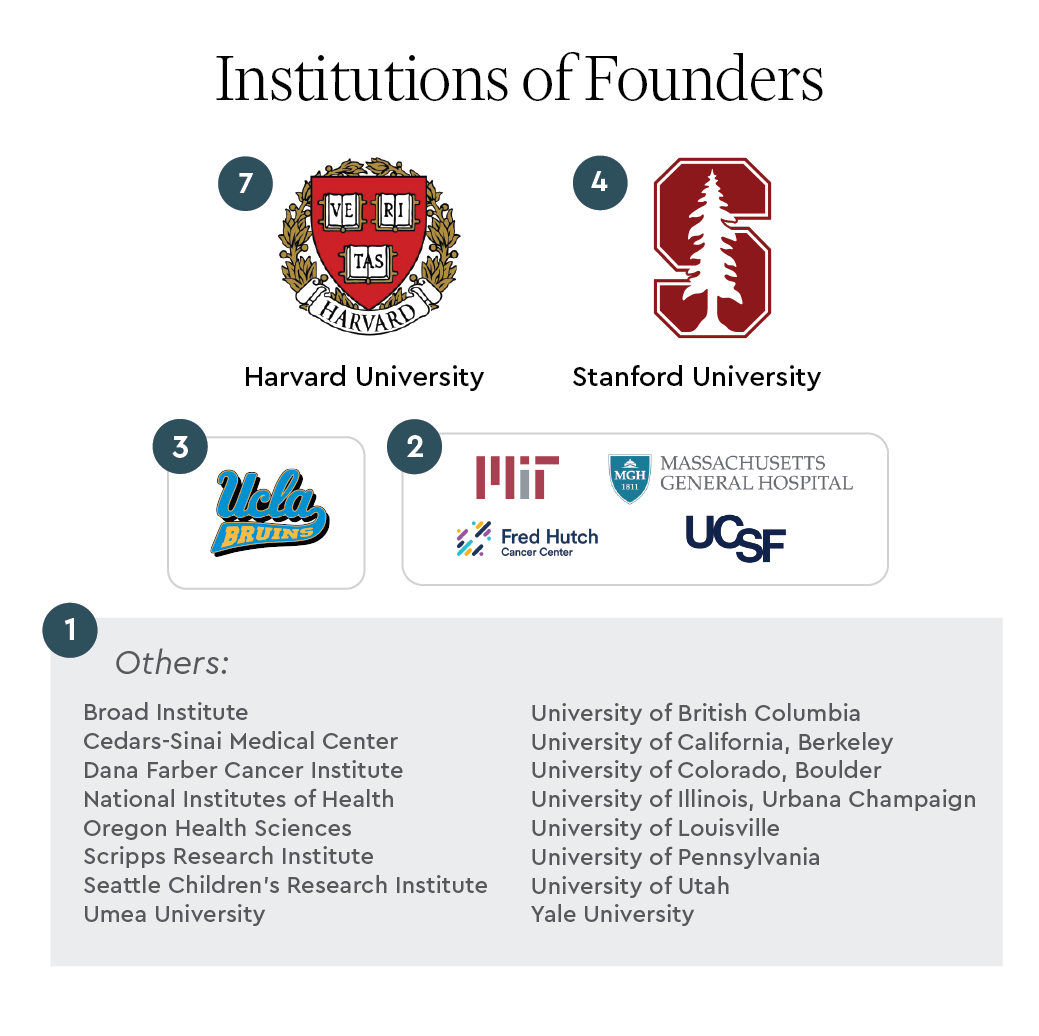
Many biotech companies have academic roots. From our list of 50 companies, 30 had founders affiliated with at least one academic institution. The institutions that boasted the most founders were Harvard (7), Stanford (4), and UCLA (3). After these were Mass General Hospital (2), Fred Hutchinson Cancer Center (2), UCSF (2), and MIT (2).
Institutions giving rise to the key technologies/drugs
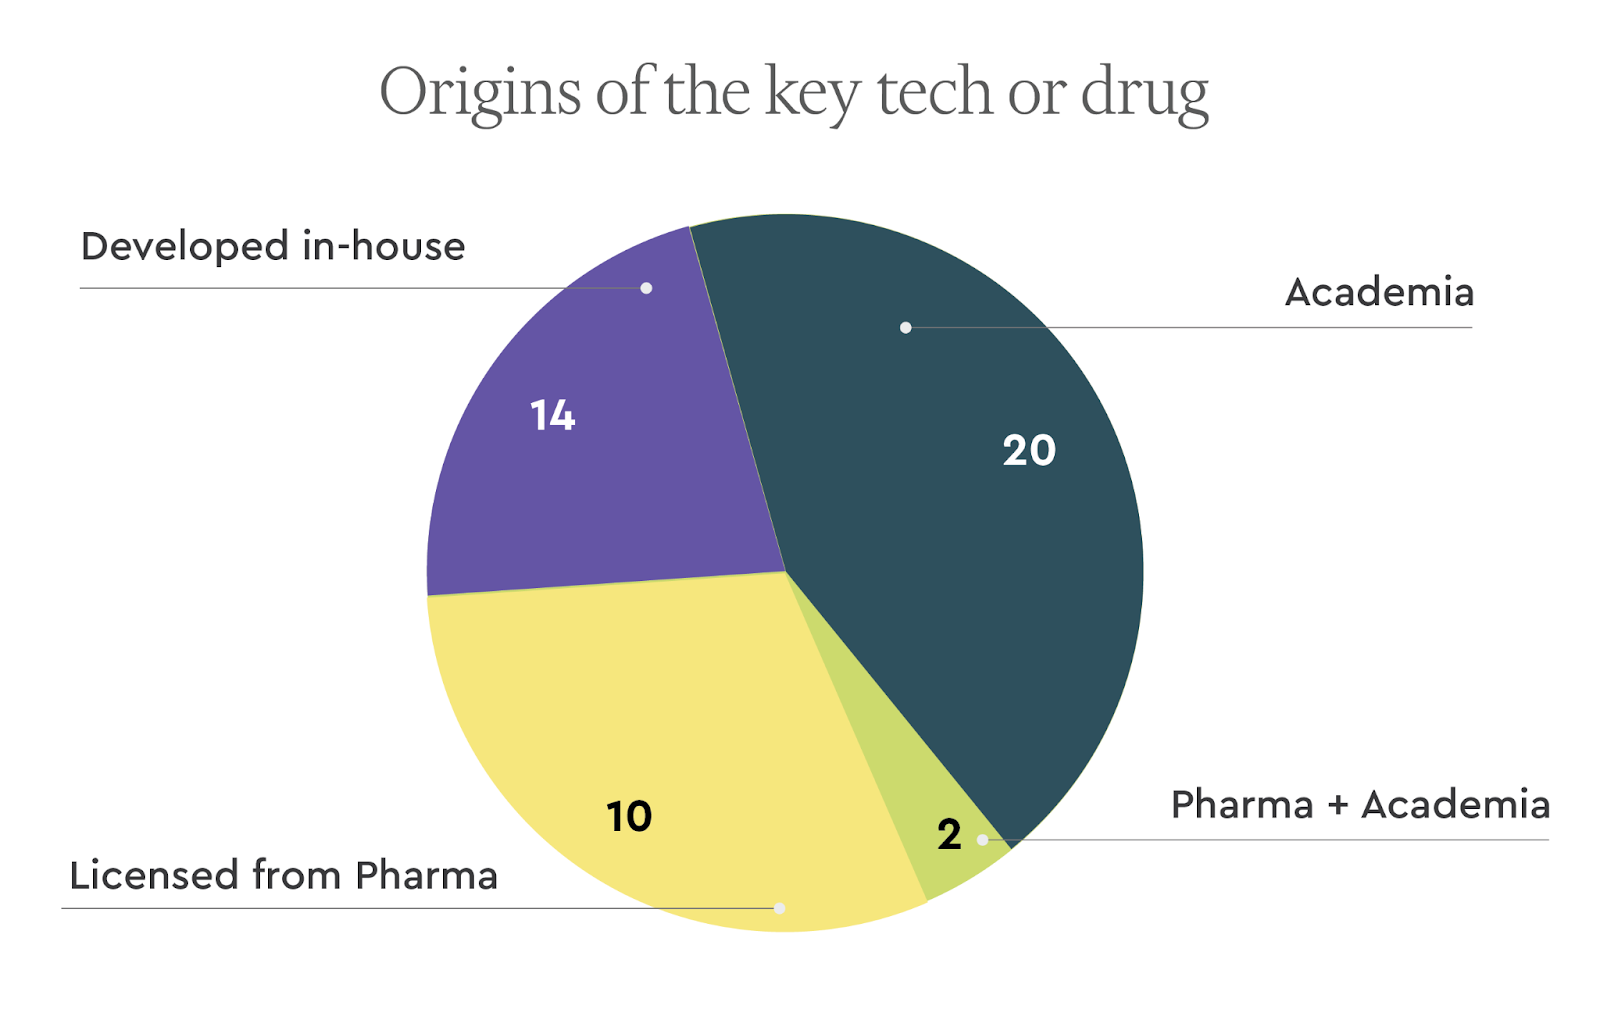
Among the top therapeutics companies, the lion’s share of leading drugs originated from academic institutions. We find it interesting that 12 of these startups licensed drugs from pharma.
The research institutions that licensed out the key drugs or technologies are widely spread. The top two originating academic institutions were Stanford (4 companies) and the University of California, San Francisco (3 companies). (We combined BridgeBio and Eidos Tx here)
| Research Institution | Number | Companies |
| Stanford | 4 | BridgeBio/Eidos Tx, Forty Seven, AbCellera (Lineage), Lyell |
| UC San Francisco | 3 | Global Blood Therapeutics, Sana, Revolution Medicines |
| Fred Hutchinson Cancer Center | 2 | Juno, Lyell |
| University of Pennsylvania | 2 | Moderna, Apellis |
| Cedars-Sinai | 1 | Prometheus |
| Children’s Hospital of Philadelphia | 1 | Spark Therapeutics |
| City of Hope | 1 | Juno |
| Genethon | 1 | Audentes |
| Harvard | 1 | Sana |
| Massachusetts Institute of Technology | 1 | Translate Bio |
| Memorial Sloan Kettering Cancer Center | 1 | Juno |
| National Cancer Institute | 1 | Kite |
| Nationwide Children’s Hospital | 1 | Avexis |
| St. Jude Children’s Hospital | 1 | Juno |
| The Chinese University of Hong Kong | 1 | Grail |
| The Scripps Research Institute | 1 | Receptos |
| UC Berkeley | 1 | Intellia |
| UC San Diego | 1 | VelosBio |
| University of British Columbia | 1 | Abcellera |
| University of Chicago | 1 | Provention Bio |
| University of Florida | 1 | Audentes |
| University of Utah | 1 | Recursion |
| University of Washington | 1 | Sana |
Geography
Half of these behemoths were founded either in the Bay Area (15 of 50) or the Greater Boston Area (10 of 50). A significant portion was also founded in Southern California (7 of 50 in San Diego and Los Angeles).
Only three of the 50 companies were founded outside of the US: AbCellera (Canada), CRISPR Therapeutics (Switzerland), and Acerta Pharma (Netherlands), although the latter two grew to establish significant presence in Boston and the Bay Area, respectively.
Company financial characteristics:
Valuations
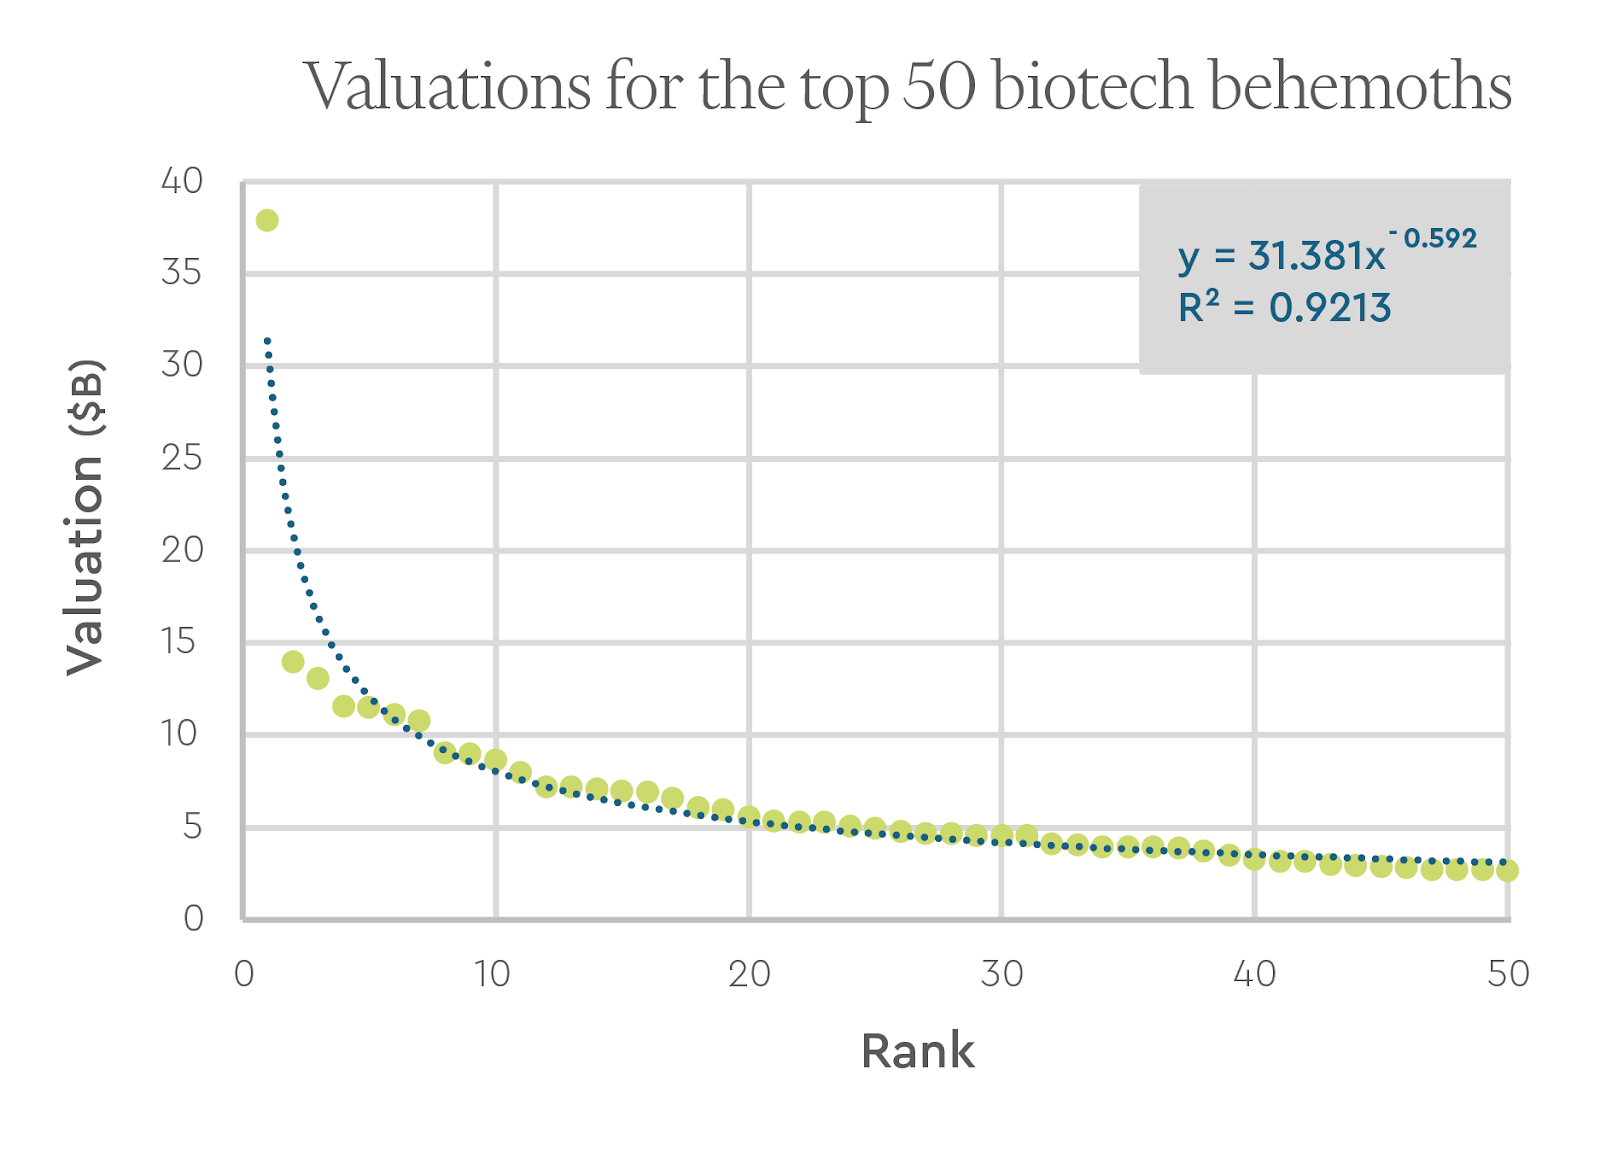
A valuation of ~$2.7B was required to make it into the top 50 companies, which represented the top 0.17% of all therapeutics and diagnostics/tools companies (~28,000) founded during the 15 year time frame. These top 50 companies also represented roughly 2.5% of all therapeutics and diagnostics/tools companies that had raised more than $50M.
These biotech behemoths are no doubt outliers. In the business of venture capital, such outliers overwhelmingly drive fund returns, and the distribution of company returns have been described by a power law. As seen below, a power law equation provides a fairly good fit for the valuations of the behemoth, although the companies in the long tail need to be included for a better estimation of the full trend.
Aggregate Multiple on Invested Capital (MOIC)
The top 50 biotech startups achieved an aggregate value of ~$322B with a total of ~$43B raised (unadjusted dollars), for a rough MOIC (here simply defined as total valuation/total investment) of ~7.5.
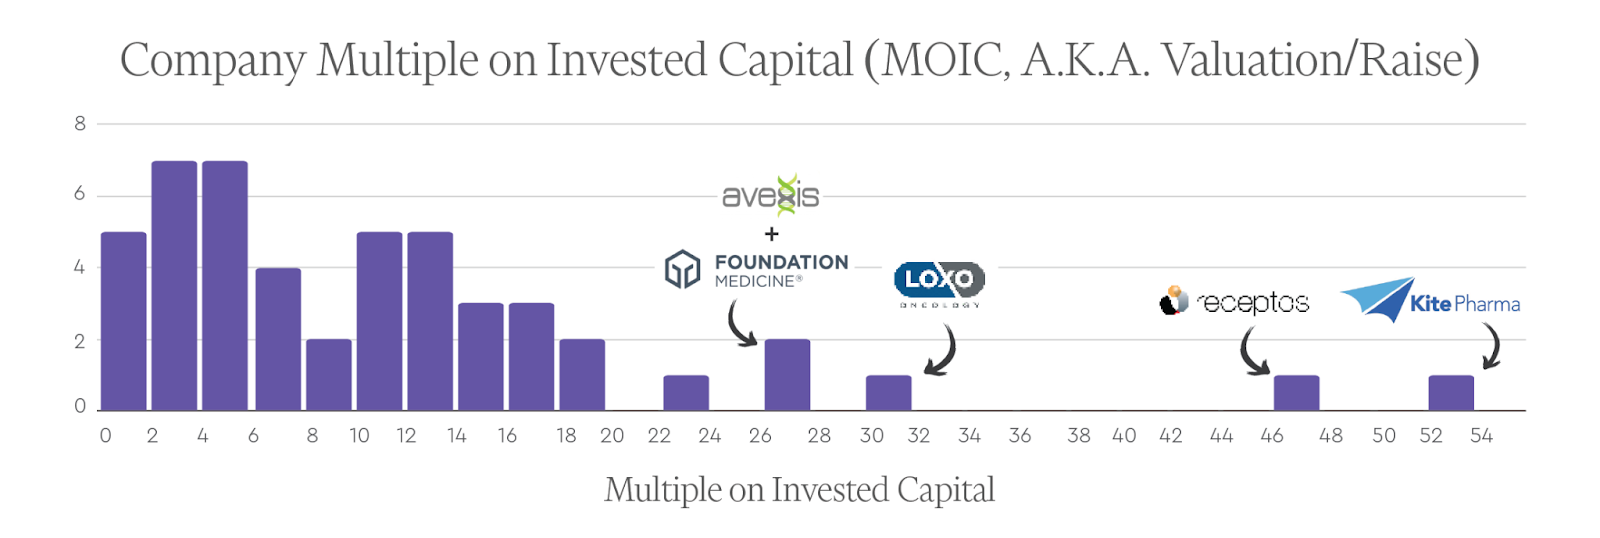
Individual Company MOICs
The average individual company MOIC (also defined as valuation/investment for each company) for the top 50 companies was ~11.7 and the median was ~9.7. The companies with the highest MOICs were Kite (~52.5x), Receptos (~46.2x), Loxo (~30.8x), Avexis (~27.6x), and Foundation Medicine (~26.8x).
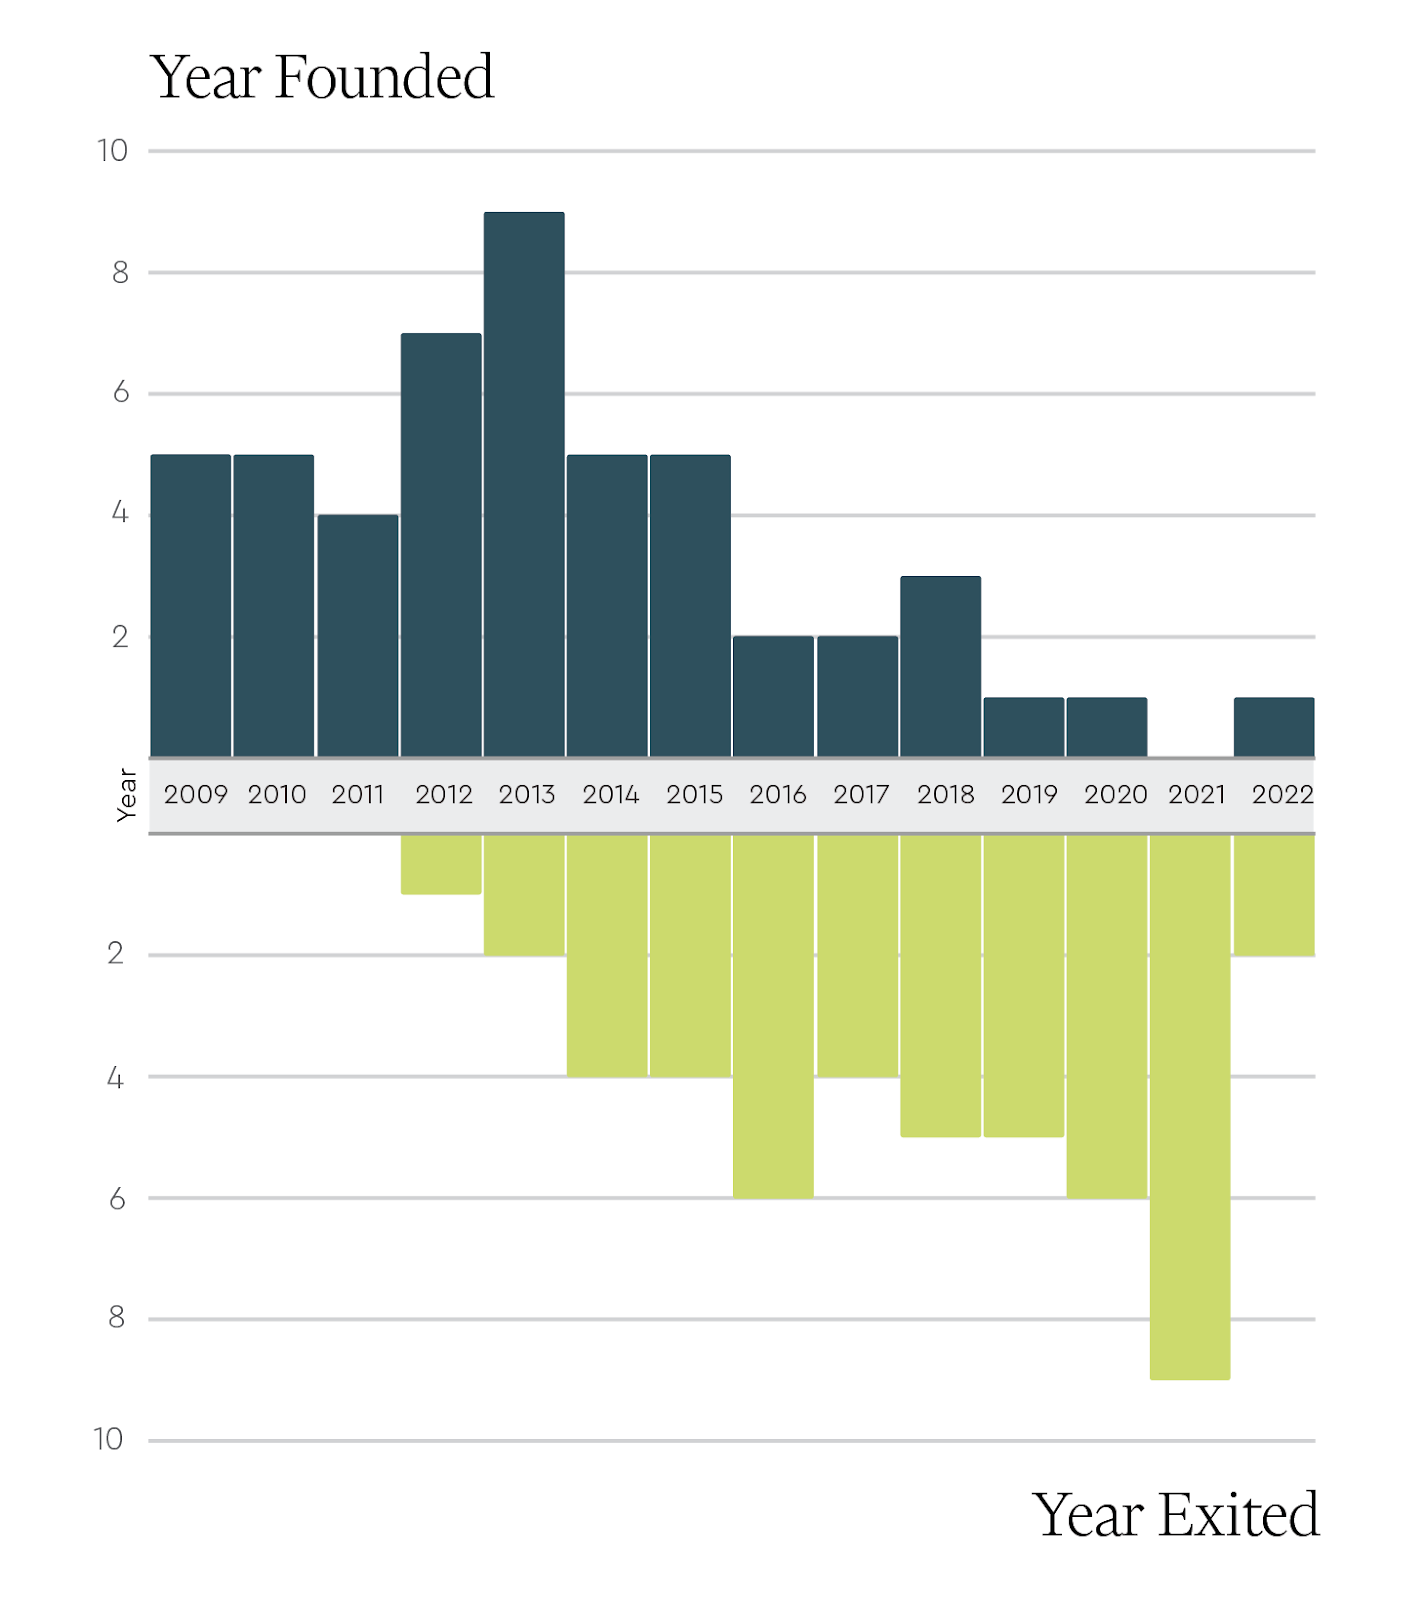
Founding Year and Exit Year
Given the time it takes for biotech companies to accrue value, the histogram of number of companies by founding year is not surprisingly skewed toward earlier years within the 2009-2023 period. Among these behemoths, the most common founding year was 2013 with 9 companies (Biohaven, Juno, Loxo, Vaxcyte, CRISPR, Spark, Turning Point, Eidos, and Recursion).
Also not unexpectedly, the year of initial exit (again, defined as either a public financing event or an acquisition) for these top 50 companies skewed later in the 15 year period and clustered around years representing favorable capital markets for biotech. 2021 was the most common initial exit year, followed by 2020 and 2016.
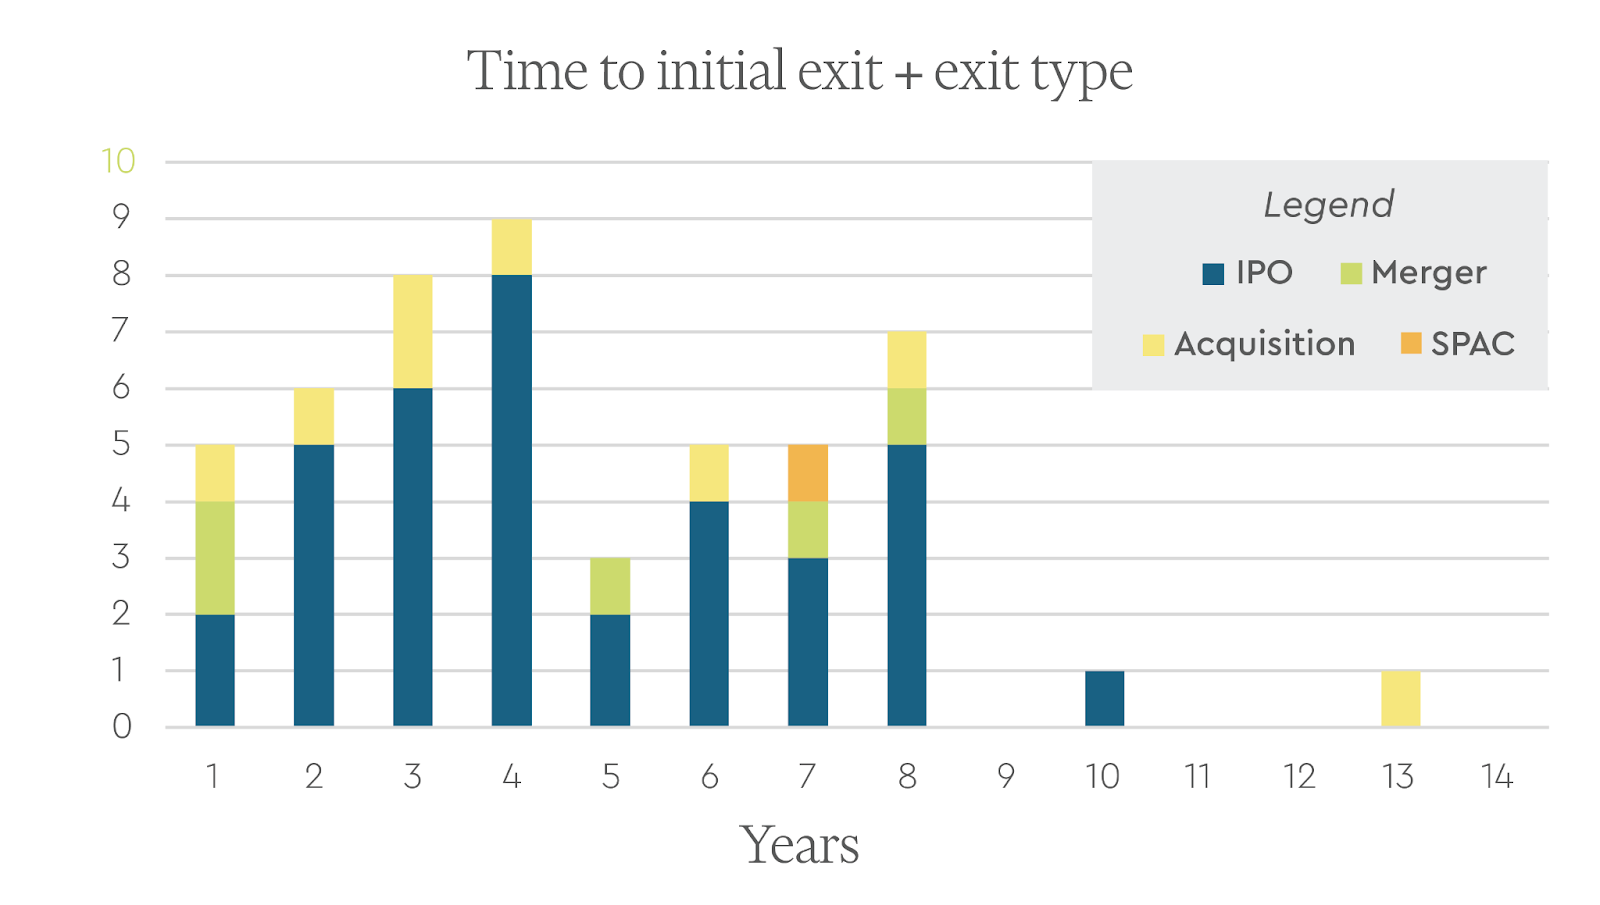
Time to Initial Exit
We looked at the number of years it took for these companies to get to an initial exit. Among these behemoths, the mean number of years was 4.7 years with a standard deviation of 2.7 years. Remarkably, 5 companies achieved an initial exit the next year after founding (Juno, Telavant, Loxo, Immunovant, and Chinook).
Comparison to top tech startups:
To contextualize selected data regarding these top biotech startups, we ran an analogous search for the top 50 tech companies founded during the same period.
The top 50 tech companies (“the tech titans”) had a higher average valuation than the biotech behemoths. Notably, the most valuable tech company on the list was Uber ($156B), worth almost 4x the most valuable biotech company, Moderna ($38B), and also worth almost half of the behemoths combined. The lowest valuation among the tech titans was $3.2B (representing the top 0.2% of all tech companies founded in the period), whereas it was $2.7B for the biotech behemoths (also representing slightly under 0.2% of biotech companies founded in the period).
For the tech titans, the average company MOIC was 23.2 and the median was 9.4. The average was driven up by companies like WhatsApp (~317x), the TradeDesk (~197x), and Honey (~56x). The average company MOIC for the biotech behemoths was lower at 11.7, though the median company MOIC was comparable at 9.7.
In aggregate, despite the many differences across these two industries, the rough MOICs of the top startups as a class looked surprisingly similar (~7.4 for tech & ~7.5 for biotech).
One key difference, however, was that the average time to an initial exit for the titans (8.2 +/-2.1 years) was considerably longer than that for the behemoths ( ~4.7 +/- 2.7 years).
Additionally, M&A was a much more important type of exit for the behemoths vs. the titans. For the biotech startups, acquisitions represented 24% of initial exits, and ultimately 52% were acquired. Only 18% of the tech companies went on to an ultimate acquisition.
We next compared the ages of the founding CEOs. The average age of the CEOs at founding for the titans was significantly younger at ~36 +/- ~8 years vs. that of the behemoths at ~46 +/- ~10 years.
Lastly, for those companies that went public, and that retained the founding CEO at IPO, we compared the CEO stake just before IPO. As seen in the summary below, the founding CEOs of the titans tended to retain more equity in their companies compared with those of the behemoths, with the median ownership in tech (11.7%) approximately double that in biotech (5.6%).
| Founding CEO Equity Just Before IPO | Biotech Behemoths(n=29) | Tech Titans(n=30) |
| Median | 5.6% | 11.7% |
| Mean | 10.0% | 12.8% |
| Standard Deviation | 11.5% | 8.6% |
| Max | 54.6% | 41.5% |
| Min | 1.0% | 2.6% |
Discussion and takeaways:
In this review of the top 50 biotech startups across therapeutics, diagnostics, and life sciences tools, the biotech behemoths were overwhelmingly drug companies. Even though diagnostics and tools companies undoubtedly create enormous value for patients and for the industry at large, the realities of their business models (generally lower pricing power and lower margins) render them arguably worse at capturing and retaining this value compared with therapeutics companies.
How did these particular biotech behemoths accrue such value? It’s clear that there was no one pathway to success.
Many companies focused on specialty drugs in oncology or rare disease, but two of the biggest behemoths focused on COVID and migraine, respectively – rather common indications.
Some companies developed their own products and technologies in-house, but most licensed them from academia or from other pharma companies. Some companies were VC-incubated, while many others were founder-led. Some companies brought flashy platforms to bear, but many others were asset-focused.
Some companies had experienced CEOs, but many others had first-time CEOs. Some companies boasted scientific founders from Stanford or Harvard, but the vast majority did not.
While there was an abundance of behemoths located in the key biotech hubs where capital, innovation, and management talent converge, i.e. the Bay Area and Boston, there was still a rather wide geographical spread – at least in the US. There were remarkably only 3 behemoths founded outside of the US.
Regarding the comparison between the biotech behemoths and the tech titans, most would agree that the two types of companies look radically different with respect to capital intensity, technical risk, degree of regulation, preponderance of binary outcomes, the market sizes addressed, and so on. Indeed, the most stunning successes for the behemoths paled in comparison with some of the titans in terms of both valuations and the multiples on invested capital achieved.
Yet when it came to the metric of total value created to total investment for the entire class, the overall showing for the behemoths was surprisingly similar to that of the titans.
The behemoths also tended to return capital faster than the titans due to the greater role that M&A has in biopharma (thanks to drugs continually losing exclusivity) and due to the availability of robust public capital markets to help fund expensive and risky late-stage clinical development. These findings should give prospective founders of biotech behemoths some relief.
Ultimately, what draws many to our industry is the prospect of bringing forth a new medicine that completely changes the existing standard of care; a diagnostic that adds years to a patient’s life because the disease was caught early or the right therapy was selected; or a technology that uncovers unknown biology and paves a path toward a better treatment.
By this measure, the biotech behemoths highlighted here were certainly the standard bearers for the past 15 years, developing, among other achievements, the first mRNA vaccine brought to market at a breakneck pace to address a global pandemic; a treatment for schizophrenia that precisely targets a novel pathway in the brain, while carefully avoiding side effects elsewhere in the body; the first gene therapy to restore vision to patients with an inherited blindness disorder; the first cell therapies to potentially cure a portion of patients suffering from an intractable blood cancer; genetic tests to better guide care for cancer patients; and technologies to measure the variations in the genome and the transcriptome at the level of individual cells.
What will the next generation of behemoths look like? We have a handful of predictions.
- Therapeutics companies will continue to dominate. While there are headwinds with the IRA and other pricing pressures, at a high level the business model still looks favorable relative to that of diagnostics or life sciences tools, and the science is continuously progressing. We hope that we have in fact, as some data suggest, turned a corner on Eroom’s law.
- Given pharma’s appetite to build on the breakthrough successes of drugs such as GLP-1 agonists for diabetes/obesity and anti-amyloid antibodies for Alzheimer’s, we can easily see several $5-15B companies being built that focus on first-in-class or best-in-class assets within metabolic disease, neurology, and immunology.
- As has been the case since the birth of the biotech industry with recombinant DNA technology and companies like Genentech and Amgen, we will continue to see well-funded therapeutics behemoths founded on innovative platforms: new target discovery platforms, new methods for drug design, and new and improved modalities. For example, with the right business model and execution, a company that can truly solve extrahepatic, tissue-specific IV delivery of large nucleic acid cargoes could be worth billions in light of the plethora of valuable therapeutic payloads just wanting for delivery and the concomitant diseases that could be addressed.
- We will see a few software companies for biopharma reach $3-5B. Pharma spends over $200B globally on R&D, but very little on software, and it shows. Much of the software stack in use today by biopharma R&D teams is outdated, clumsy, or fragmented. This current state, paired with the expectation that AI will impact many parts of the drug development value chain beyond target or drug discovery, suggests that eventually pharma companies will have to spend significantly more on software or risk losing their edge.
- The Bay Area and Boston will continue to dominate the rankings as network effects in these hubs compound over time.
- The founding CEOs of behemoths will continue to trend older than those of the titans. We think this difference in part reflects the substantial education and experience that can be crucial for founders to succeed in the complex, regulated industry of biotechnology. Perhaps as importantly, access to the substantial amounts of capital needed to achieve important value inflection points in therapeutics companies will likely continue to be gate-kept by blue chip investors who are reluctant to take on significant team risk, in addition to the many other types of risk present in these businesses.
- However, we expect the founding CEO list to grow more diverse across both race and gender thanks to industry-wide efforts to promote diversity and inclusion among company boards and senior leadership teams.
We here at Pear are excited to back the next generation of such behemoths, and we can’t wait to see the impact they make on patients and our industry.
Acknowledgements:
We thank Mar Hershenson, Sarah Jones, Daniel Simon, Elliot Hershberg, and Curt Herberts for their helpful feedback and comments on earlier drafts of this review, as well as Joanna Shan for optimizing the graphics.