
A startup’s potential scale is bound by its future market size, and consequently “what is your market size?” is one of the determining questions that most VCs ask early stage entrepreneurs.
Why does market size matter?
How to estimate your market size?
What is the exact definition of market size?
When should market size be estimated for?
If you only take a few things from this article:
- Big companies can only exist in big markets.
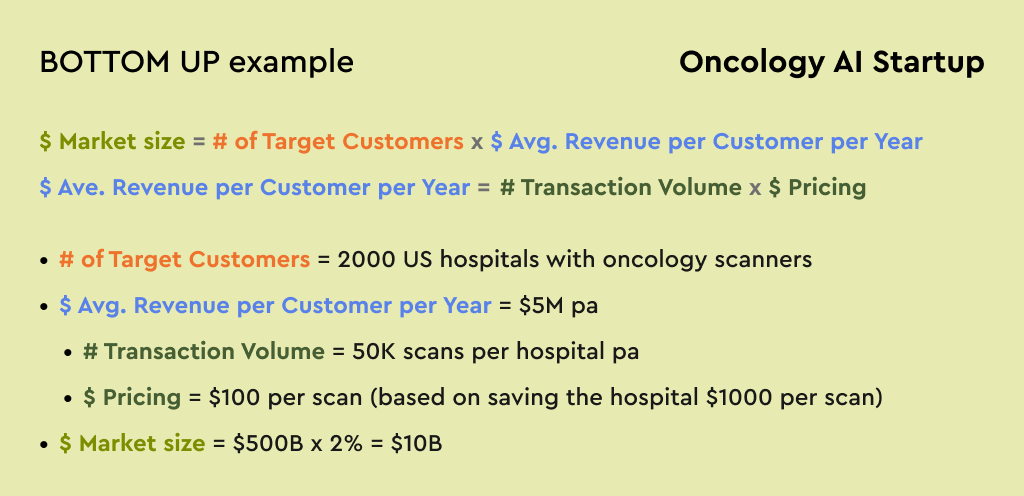
- Estimate market size using a bottom-up approach not top-down. In other words, multiply the number of customers by the average revenue per customer per year (which you can estimate through multiplying transaction volume by price).
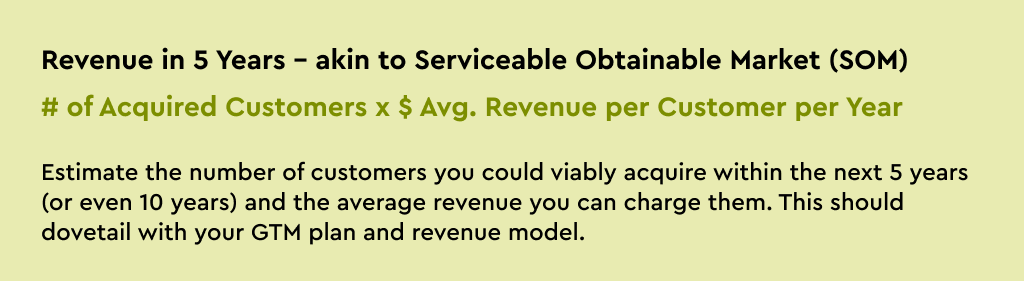
- Present your total addressable market and your future revenue for 5+ years into the future.
At Pear we consider an entrepreneur’s clarity of thought and enduring ambition as more important than the market size number in a pitch deck. The objective of market sizing is to demonstrate that you are targeting a big market opportunity that you understand deeply. Startups have many unknowns and market sizing is a rough estimation, so keep it simple.
1. Why does market size matter?
Big companies can only exist in big markets.
Founder perspective: If you want to build a company that has a DoorDash-sized impact on the world then make sure to commit yourself to a sufficiently large market opportunity.
Investor perspective: If you want to raise capital from VCs then you need to convince them that your company will generate an exit value that returns their fund. In your pitch you should aim to convey that your startup has the potential to capture at least hundreds of millions of dollars of high-margin revenue within the next decade, within a multiple billion dollar market.
2. How to estimate market size?
Use the bottom-up approach to estimate market size. Multiply the number of customers by the average revenue per customer per year.
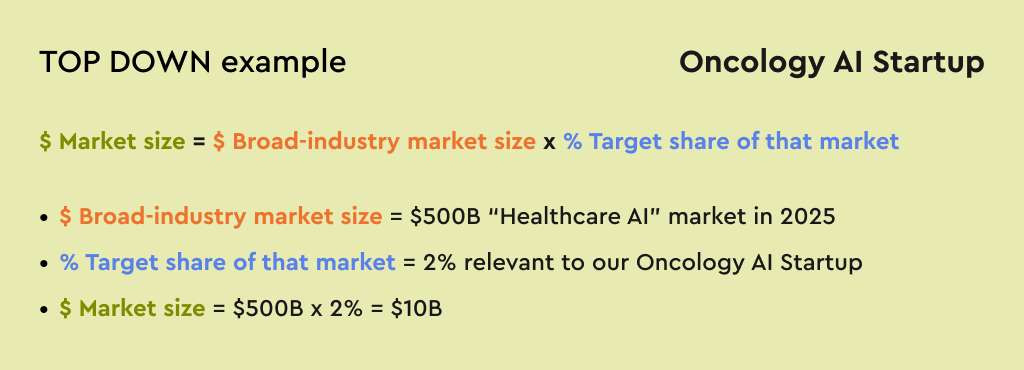
There are top-down and bottom-up approaches to estimating market size. The bottom-up approach is more convincing because its uses assumptions that are substantiated through other aspects of your pitch, such as customer definition, revenue model, and GTM. VCs also prefer bottom-up because the underlying assumptions can be tested and validated. Ideally you will only use top-down to sanity check the magnitude of your bottom-up estimate.
Keep your method simple and easy to explain. The underlying assumptions for market sizing will remain rough until you have ascertained your exact target customers and revenue model, so avoid undue complexity.
3. What is the exact definition of market size?
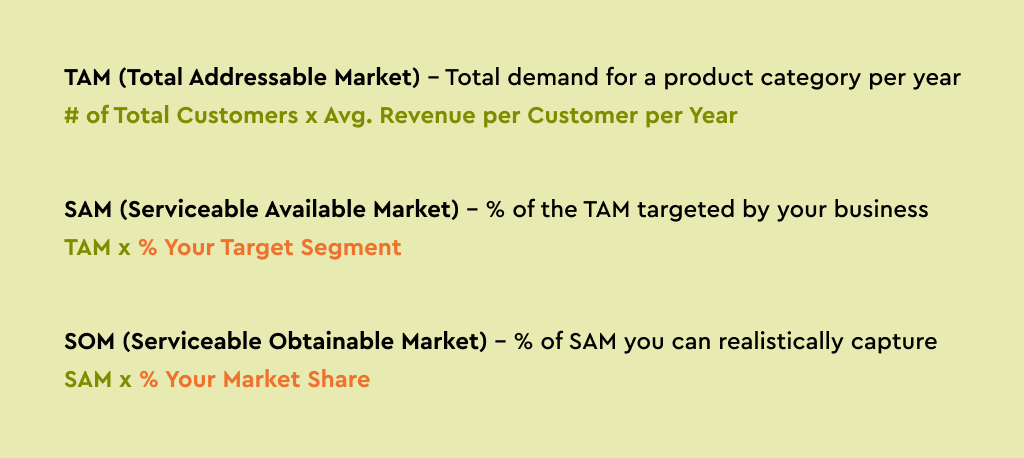
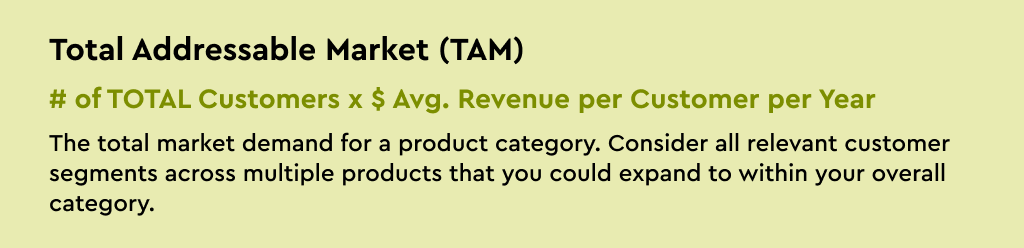
There is no single definition of market size. Early stage companies typically present three estimates for TAM / SAM / SOM. I encourage you to skip the acronyms and present bottom-up estimates for your total addressable market and your revenue in 5+ years.
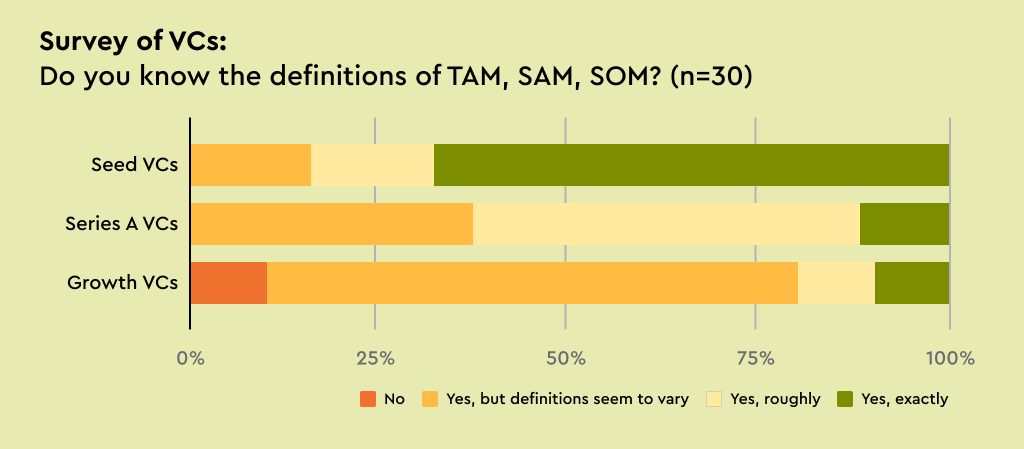
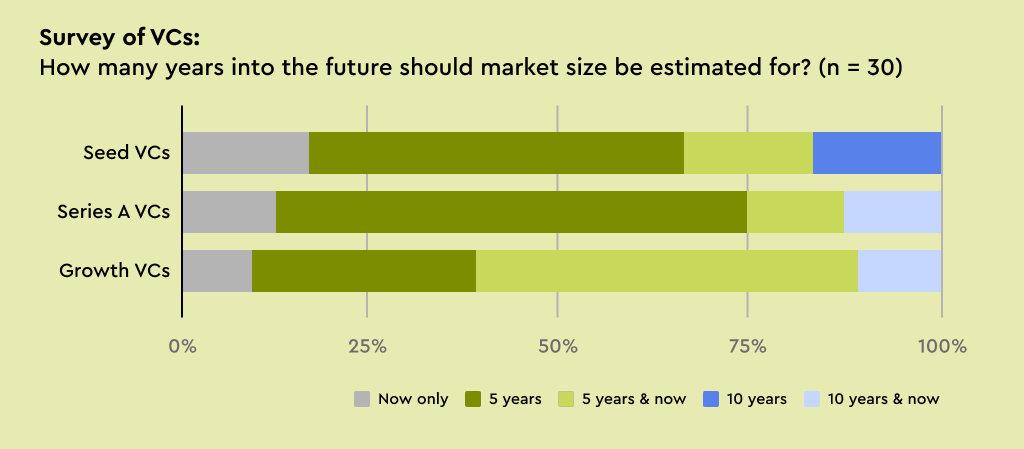
We surveyed 30 VCs to better understand how other investors evaluate a startup’s potential scale. We learned that earlier stage investors tend to prefer market sizing presented as TAM / SAM / SOM, whereas later stage investors care more about recent revenue growth as well as estimates for future revenue.
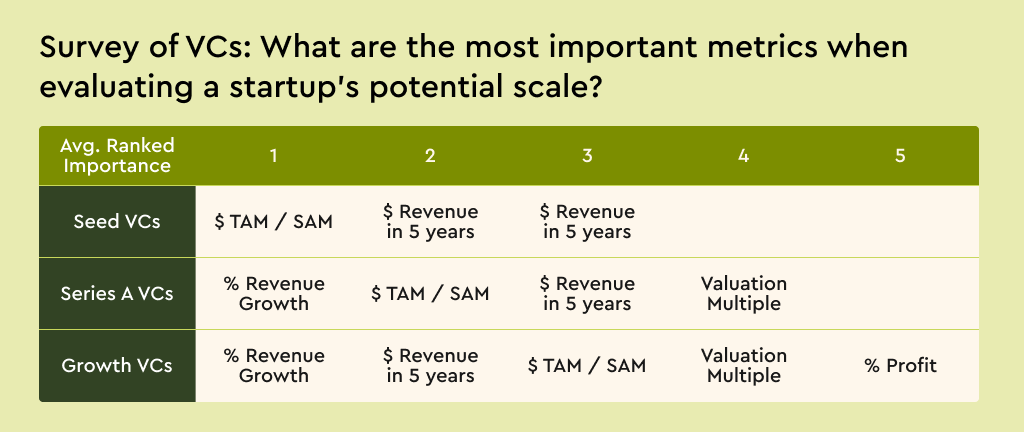
- Seed VCs generally value TAM estimates more because they have limited additional information to inform decisions. We heard from seed investors that: “TAM / SAM / SOM works fine as long as the methodology is clear.”
- Series A VCs told us that they care more about future revenue even when looking at seed stage startups: “A bottom-up build of future revenue is more useful than basing SOM on a hypothetical % share of TAM or SAM.”
- Growth-stage VCs pay less attention to market sizing and we heard that: “TAM is a crude indicator. Revenue growth is a better signal. It’s hard to grow 200% at scale if there’s a small TAM.”
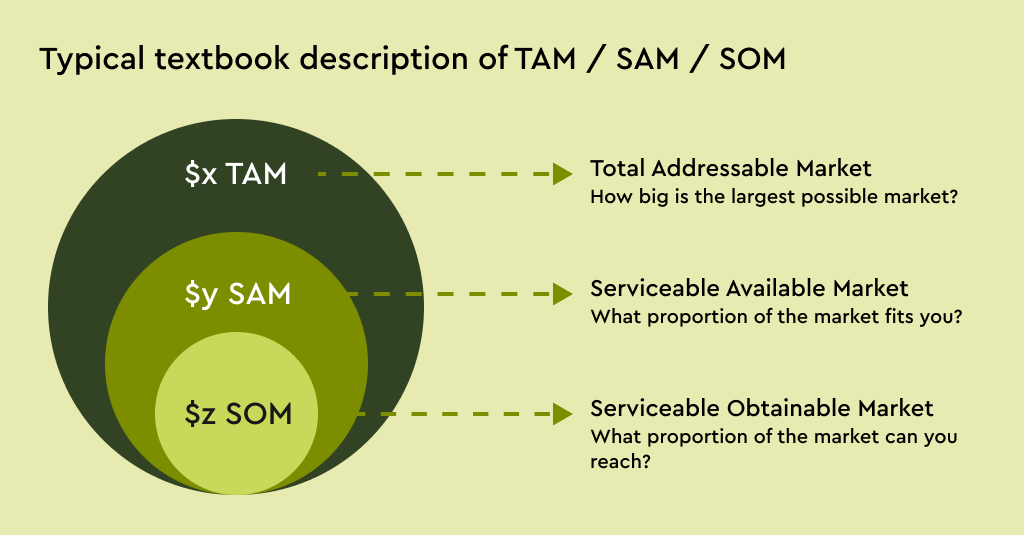
The textbook definitions for TAM / SAM / SOM are vague.
You might have seen TAM / SAM / SOM in an article or a pitch deck. If you Google these acronyms and read a few articles then you’ll likely find varying fuzzy explanations (one example depicted below). Pitch decks often include a market sizing illustrated as three bold numbers within three concentric circles, without context or assumptions. Such minimalism saves one from committing to definitions that we might be unsure about, but it also forfeits this opportunity to present a compelling narrative that convinces investors.
Based on our survey of 30 VCs, it seems that many investors do not know the exact definitions either. So when presenting your market sizing, explicitly state your methodology rather than assume universal definitions. (These survey results also had me wondering whether later stage VCs are more honest about their knowledge gaps!)
The textbook estimation approach for TAM / SAM / SOM is TOP DOWN ⚠️
Marketing textbooks generally describe the TAM / SAM / SOM approach as: first estimate your largest possible market for $ TAM, of which estimate a narrower proportion that fits your company for $ SAM, and then estimate the % market share you can reach to get to $ SOM. However, the % market share assumption is often an unsubstantiated afterthought, which results in a meaningless estimate for your company’s potential revenue. This approach encourages top-down thinking and is unconvincing.
The most consistent feedback in our VC survey was to dissuade founders from presenting their future revenue based on % market share of a large addressable market. So, what’s a better approach?
Present bottom-up estimates for your total addressable market and for your revenue in 5 years.
The market sizing definitions stated below are based on consensus across surveyed VCs. However, interpretation still varies so state your assumptions. Also, enough with the acronyms — replace the jargon with more meaningful descriptors.
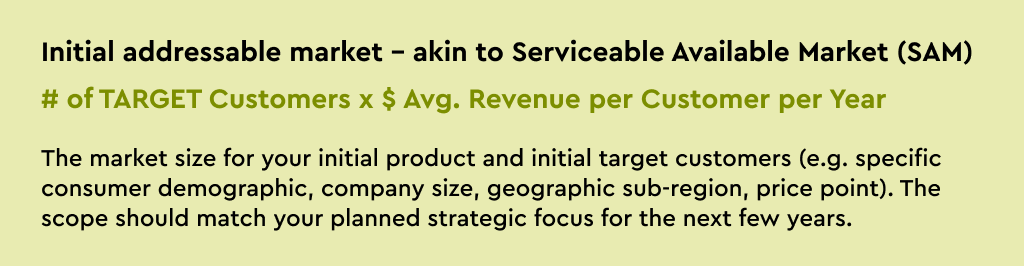
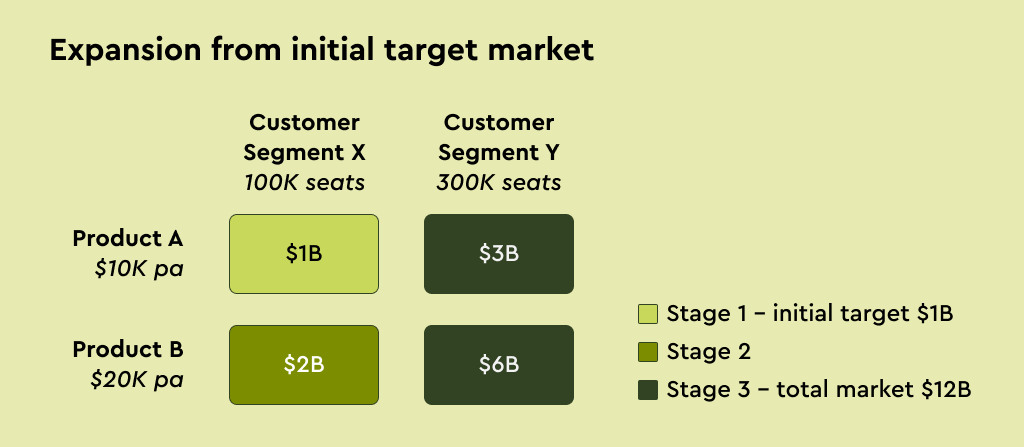
Some of the surveyed VCs encouraged founders to drop the conceptual distinction between TAM and SAM. However, opinions on this topic were mixed. Instead of presenting both TAM and SAM, you could communicate your plan for incremental expansion across customer segments and products.
eg. Start with an initial wedge of selling product A into customer segment X. Then expand through cross-selling product B into the same customer segment X. Followed by expanding further through selling products A and B to a new customer segment Y.
4. When should market size be estimated for?
Estimate your market size for 5+ years into the future.
Surveyed VCs most commonly wanted to see market size estimates for 5 years into the future. If your company is many years away from IPO and/or riding a longterm industry trend (eg. transition to electric vehicles) then it’s more appropriate to estimate 7-10 years into the future.
A significant proportion of the VCs surveyed also prefer to see market size now as well as 5 years into the future. If you’re targeting a rapidly growing existing market then you can highlight that growth through presenting both now and in 5 years.
Guidance on the underlying assumptions
Now that you understand how to estimate your market size, you need to source the underlying assumptions to feed into the bottom-up equations. You can follow the following steps to arrive at assumptions for calculating total addressable market, initial addressable market, and future revenue.
1) # of Customers
1.1) Define your customers
Precisely focus on the customer segment that will contribute the majority of your potential revenue.
eg. While DoorDash could claim that every person in the US could potentially order food online, a more convincing segment might be: “Americans in the age range of 25-40, who are employed, and eat out at least once per week.”
If level of demand and/or willingness to pay varies significantly across your customer-base then you should capture such variation in your estimation through customer segmentation. Though keep it simple and only consider segments that will contribute significant revenue.
eg. Market sizing assumptions can differ significantly between SMB and Enterprise customers. If we’re selling a product into both then we should segment the market. (100K SMBs x 5 seats x $10K per seat = $5B) + (1K Enterprises x 100 seats x $20K per seat = $2B) = $7B total.
1.2) Estimate the total number of customers
The most relevant data sources vary by business category, eg.
- Consumer: If you can define your target customer (or user) segment in terms of socio-demographics then use the US Census Bureau data on US Population.
- Vertical-specific B2B: You can identify the number of relevant companies within an industry vertical using US Census Bureau data on US Companies.
- Enterprise: If you your future revenue will be concentrated in big enterprise accounts then identify what proportion of companies within the Fortune100 or Fortune500 would buy for your product.
Additional example data sources:
- Research reports (eg. Gartner, Forrester, McKinsey, BCG)
- Government agencies (eg. Bureau of Labor Statistics, Bureau of Economic Analysis, US SBA, trade.gov, Bureau of Transportation, Dept of Housing, US Dept of Agriculture)
- Industry bodies (eg. National Business Group on Health, National Restaurant Association, National Association of Realtors)
- NGOs (eg. UN Dept of Economic & Social Affairs, UN World Tourism)
- S-1s of companies in your category
1.3) Estimate the number of customers you could acquire in 5 years
You will acquire only a proportion of total customers We need to estimate a realistic number of customers captured by around the time you IPO, so 5-10 years from today. Its best to build this bottom-up through considering how many new customers you’ll be able to acquire (and retain) per year over the next 5-10 years.
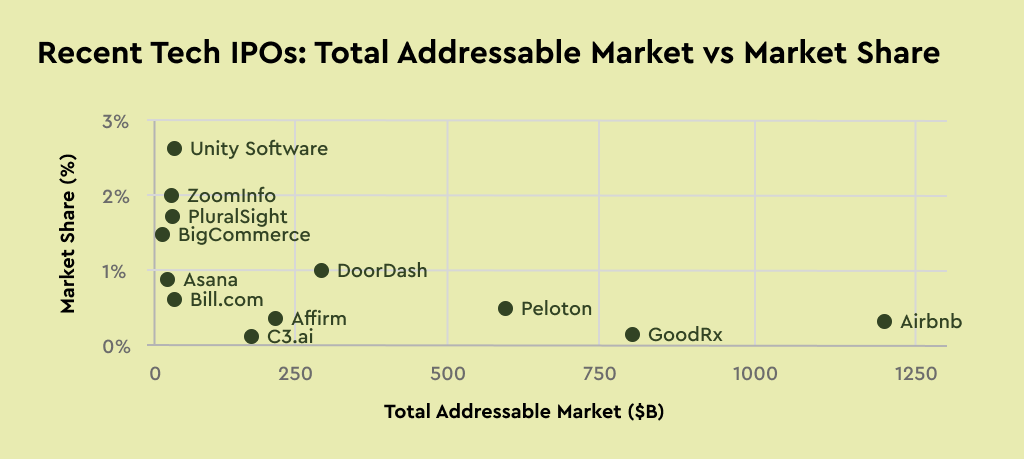
Sense check your implied market share. Look at the market shares of existing dominant players in your category and in adjacent categories. Also consider strength of network effects, how entrenched established players are, and ease of distribution (eg. capturing 10% of the Fortune100 is more realistic than capturing 10% of 100,000 SMBs).
Our expectations for high market shares are often anchored in the dominant consumer-facing FAANGs, yet many other categories are more fragmented or under-penetrated. Pitch decks often state a 10% potential market share. Yet when tech companies IPO they have typically only attained a 0.1% to 2% share of their addressable market. See the chart below based on data in S-1s of recent tech IPOs.
2) $ Avg Revenue per Customer per Year
2.1) Select your revenue model
Identify the most relevant revenue model for your business. You might foresee multiple revenue streams, however its best to keep it simple and focus the market sizing on your core revenue stream. See the table below for examples (though this is not an exhaustive list).
Each revenue model is split into transaction volume multiplied by pricing.
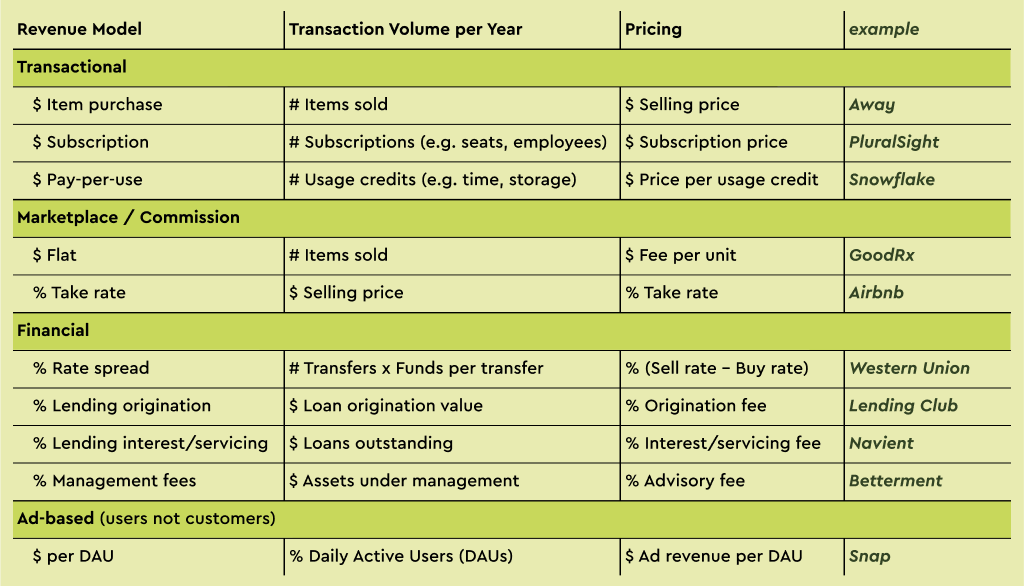
2.2) Estimate Transaction Volume
This requires you to understand your target customer’s behavior. (eg. How many product will they consumer per year, How much data storage will they require, How many seats per company, etc.)
2.3) Estimate Pricing
Pricing is an artform worthy of volumes, and in practice you might chose to implement multi-tiered pricing differentiation to maximize your profits. But again, for estimating market size, minimize the complexity.
There are three main approaches to pricing. Value-based pricing is generally the best approach.
- Value-based: Estimate how much value your customer attains from your product, and charge a proportion of that value. You can charge more through: (i) creating greater value for your customer; and/or (ii) heightening your customer’s perception of that value creation. Attribution is as important as the actual impact of your product. A rule as thumb is that you can charge in the range of 10-30% of the value you create for your customer.
- Competitor-based: If your industry has pre-existing comparable products to yours then your customers are likely anchored in pre-existing price ranges. When pitching to VCs you might need to explain why your product has a premium or a discount to comparable products.
- Cost-based: Estimate the cost to deliver your product and add a margin. Fixed costs are generally low in tech companies, and this is more relevant to operationally intensive and/or asset heavy companies.
How to best apply these approaches varies by the business category, eg.
- B2B SaaS: Value-based pricing is the optimal approach to determine your customer willingness to pay. (eg. If your products increase your customer’s profits by $1M per year on a perpetual basis then you can charge a $100-300K per year subscription fee.)
- Consumer: Anchoring to the price of adjacent products often informs the attainable price, unless your brand is highly differentiated. This also applies to consumer fintech. (See this article)
- Healthcare: B2B healthcare solutions sold to payers or employers usually have a fee per member per month revenue model, and you can charge a proportion of the cost savings you deliver. D2C healthcare solutions usually a fee for service or a monthly subscription revenue model, and ideally you identify relevant reimbursement CPT codes. Healthcare also includes several more complex pricing models.
- Marketplaces: The % take rate in a marketplace is driven by how much demand you can drive to your customer and how much easier you make it to run their business, as well as how competitive your market is. (See Lenny’s newsletter)
Now multiple those assumptions out. Hopefully you arrive at a big number for the addressable market. If not then revisit your assumptions as well as your overall vision.
Additional Tips
- Think long-term and dream big. Most successful startups create or change markets, so you should estimate hypothetical demand for your product in 5-10 years, not just existing demand. Also consider how you will expand average revenue per customer through solving additional problems for your target customers.
- Global market size is rarely relevant. If your strategy is US-focused then state an addressable market for the US only. If you’re starting in a smaller country and your strategy focuses on multiple similar countries then state an addressable market for those countries and be ready to explain your international go-top-market plan.
- Ensure that the revenue you are presenting is annual. (eg. If there are 10M potential customers for your product and they might buy your product every two years on average, then you have 5M target customers per year.
- For marketplaces, include take rate in the market size calculation rather than presenting overall GMV. For financial products, include fees rather than presenting total transaction value or AUM. If your B2B startup is helping your customer to increase their profits, then you can only charge a proportion of that impact.
- Read S-1s of public companies with similar customers or products as your company. Search the SEC database for a public company of interest and open their ‘S-1 Prospectus’. S-1s are a goldmine of information and provide insights well beyond market sizing.